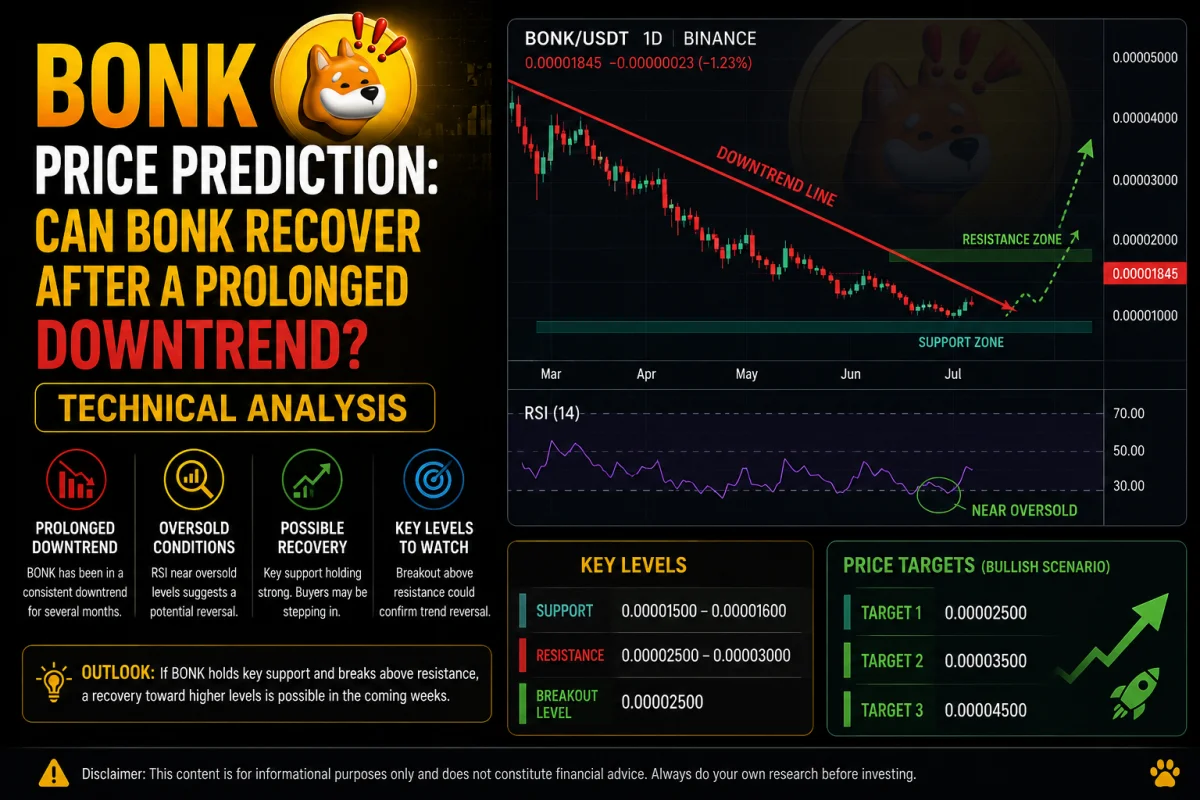
BONK price prediction based on the latest TradingView charts. Explore key support, resistance, trend analysis, and potential bullish and bearish scenarios.

BONK price prediction based on the latest TradingView charts. Explore key support, resistance, trend analysis, and potential bullish and bearish scenarios.
BONK continues to trade under pressure after an extended bearish trend across the higher timeframes. Based on the provided 4-hour, daily, weekly, and monthly TradingView charts, sellers remain in control, although the lower timeframes show early signs of buyers attempting to defend recent lows.
Traders are closely watching BONK because the token has reached an area where selling momentum appears to be slowing. Whether this develops into a larger recovery or simply another short-term bounce will depend on how price reacts around nearby resistance levels.
As always, technical analysis reflects probabilities rather than certainty, and confirmation is needed before any trend reversal can be considered.
Price Action Analysis
Higher Timeframes Remain Bearish

The weekly and monthly charts continue to display a clear long-term downtrend.
Price has been making:
- Lower highs
- Lower lows
- Repeated bearish continuation moves
This structure indicates that sellers still have the overall advantage.
The major moving averages shown on the chart remain above the current price, suggesting that the longer-term trend has not yet changed.
Daily Chart Shows Weakness

The daily timeframe continues to trade below multiple moving averages.
Visible characteristics include:
- Lower highs
- Lower lows
- Weak buying momentum
- Price holding near recent lows
Although a few bullish candles have appeared recently, they have not yet changed the overall market structure.
The trend remains bearish until buyers can reclaim higher resistance levels.
4-Hour Chart Suggests a Short-Term Recovery Attempt
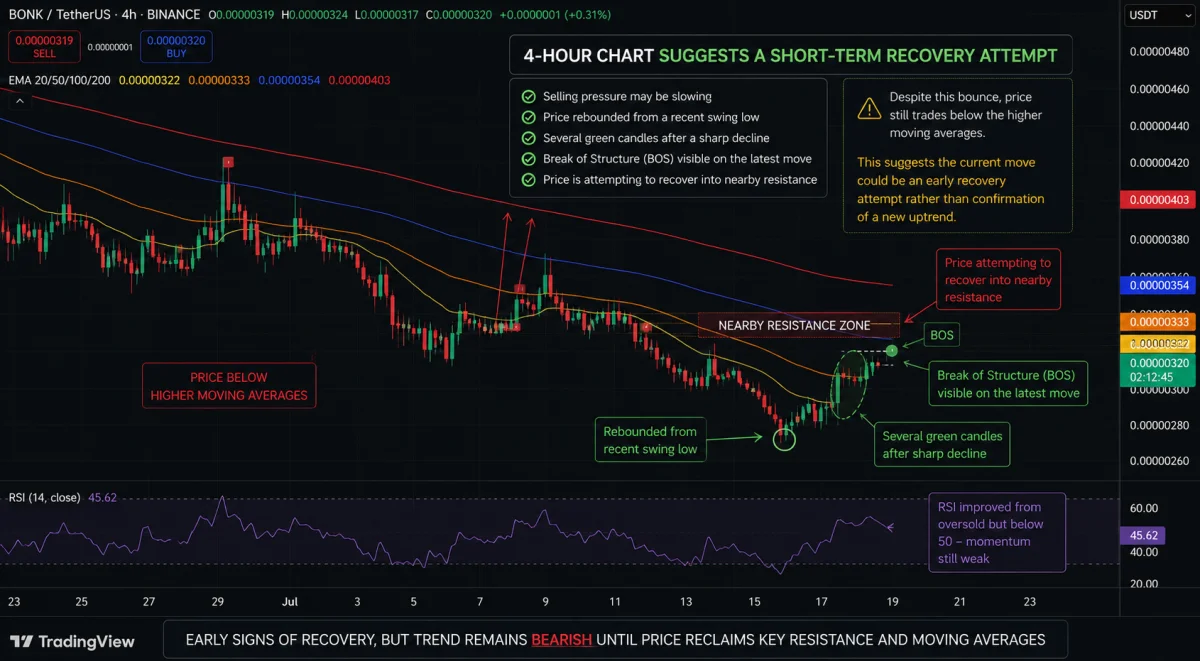
The 4-hour chart provides the first indication that selling pressure may be slowing.
Visible observations include:
- Price rebounded from a recent swing low.
- Several green candles have appeared after a sharp decline.
- A Break of Structure (BOS) marker is visible on the latest move.
- Price is attempting to recover into nearby resistance.
Despite this bounce, the market still trades below the higher moving averages shown on the chart.
This suggests the current move could be an early recovery attempt rather than confirmation of a new uptrend.
Support and Resistance

Key Support Zone
The charts show buyers reacting around the recent swing lows.
This support area has already attracted buying interest several times, making it an important level to monitor.
If this zone fails, BONK could remain under bearish pressure.
Immediate Resistance
The nearest resistance appears around:
- Recent lower highs on the 4-hour chart
- Short-term supply zones highlighted on the chart
- The nearby moving averages
These levels are important because previous rallies struggled to move above them.
Major Resistance
Higher resistance remains near the longer-term moving averages visible on the daily and weekly charts.
A sustained move above these levels would provide stronger evidence that buyers are regaining control.
Technical Indicators
Moving Averages
The charts display several moving averages.
Current observations:
- Price remains below the longer-term moving averages on the daily, weekly, and monthly charts.
- The shorter moving averages on the 4-hour chart are beginning to flatten after the recent bounce.
- Long-term moving averages continue to slope downward, indicating that the broader trend remains weak.
Overall, moving averages continue to favor sellers.
RSI
The RSI values visible on the charts remain below the midpoint on the higher timeframes.
This suggests momentum is still relatively weak despite the recent rebound.
The 4-hour RSI has improved compared with recent lows, indicating that short-term buying momentum has increased, but stronger confirmation would be needed for a sustained trend reversal.
MACD
The charts show mixed momentum.
- Higher timeframes continue to display bearish momentum.
- The 4-hour chart shows improving momentum compared with earlier selling pressure.
While this may support a short-term recovery, it does not yet confirm a long-term bullish reversal.
Chart Patterns
No major classical chart pattern, such as a Head and Shoulders, Cup and Handle, Ascending Triangle, or Double Bottom, is clearly confirmed on the provided charts.
Instead, the dominant pattern is a prolonged bearish trend with a recent relief bounce from support.
Additional price action would be needed before any reversal pattern can be confirmed.
Bullish Scenario

For buyers to gain stronger control, BONK would likely need to:
- Hold above the recent support zone.
- Continue forming higher lows on the 4-hour timeframe.
- Break above the nearby resistance levels.
- Reclaim the major moving averages visible on the daily chart.
If these conditions are met, market sentiment could gradually improve.
However, confirmation from higher timeframes would remain important.
Bearish Scenario
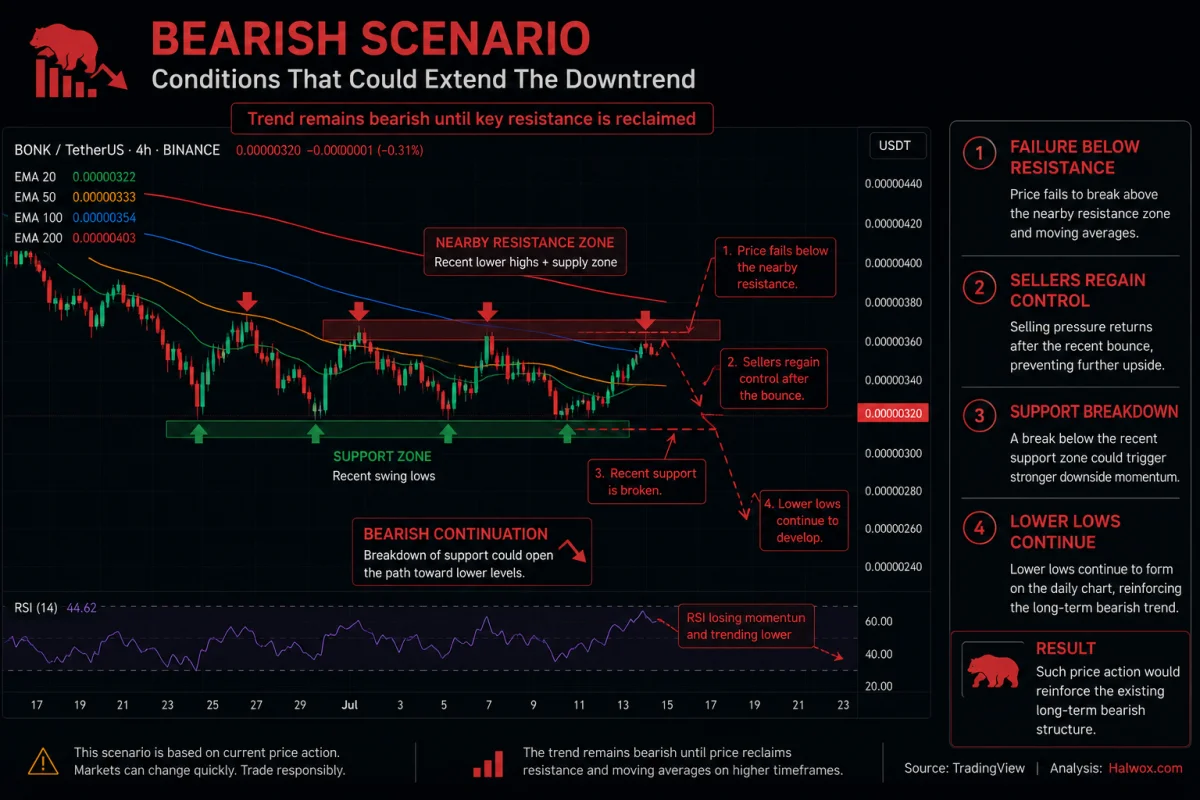
The bearish trend would likely continue if:
- Price fails below the nearby resistance.
- Sellers regain control after the recent bounce.
- Recent support is broken.
- Lower lows continue to develop on the daily chart.
Such price action would reinforce the existing long-term bearish structure.
Risk Factors
Several factors could influence BONK's next move:
- Bitcoin's overall market direction.
- Sudden increases in market volatility.
- Crypto-related news or macroeconomic developments.
- False breakouts above resistance.
- Low trading volume reducing the strength of any recovery.
These factors may significantly impact price action regardless of current technical signals.
Final Outlook
The provided charts suggest that BONK remains in a broader bearish trend across the daily, weekly, and monthly timeframes. While the 4-hour chart shows an encouraging short-term rebound from recent lows, the overall market structure has not yet shifted in favor of buyers.
Key support continues to hold near the recent swing lows, while nearby resistance and longer-term moving averages remain the main obstacles for any sustained recovery.
Overall, the chart suggests buyers are attempting to regain momentum, but confirmation above key resistance levels is still needed before a stronger bullish outlook can be considered. Until then, the broader market bias remains cautiously bearish, and traders should remember that technical analysis reflects probabilities rather than certainty.