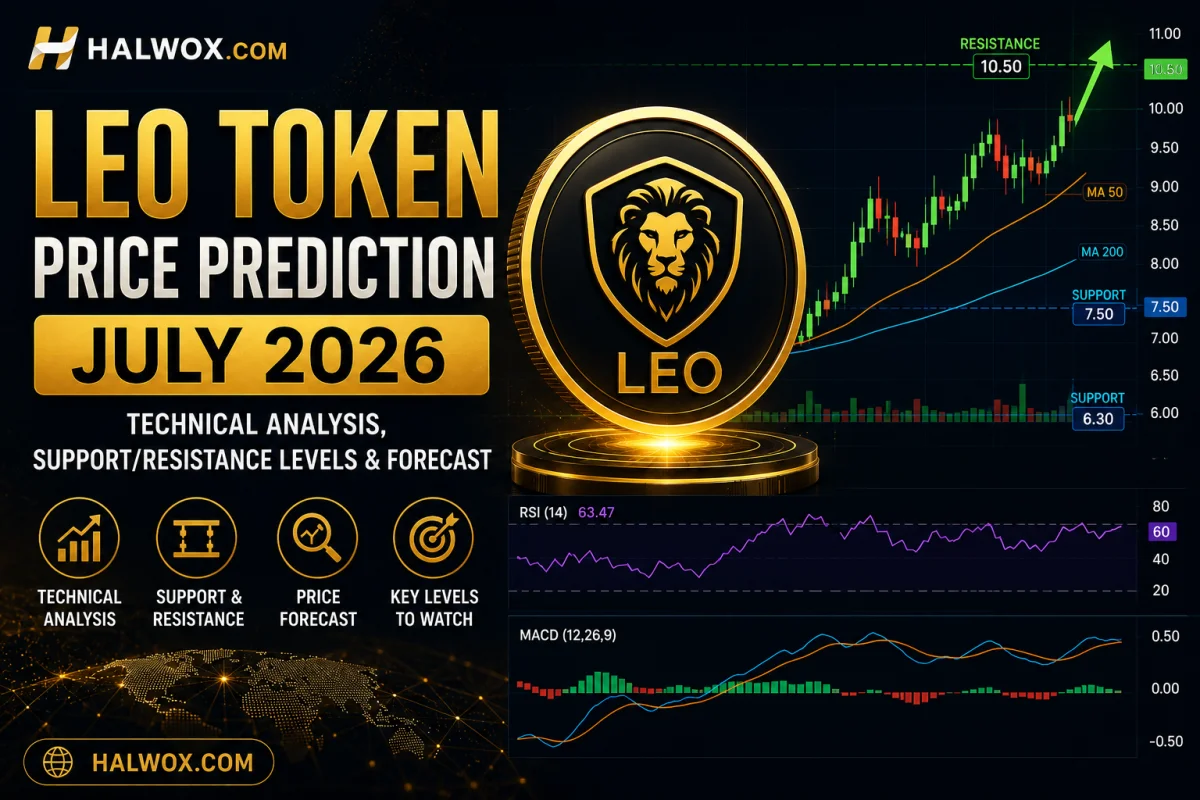
In-depth LEO Token (UNUS SED LEO) price prediction for July 2026 — current trend, support/resistance levels, RSI, MACD, moving averages, and realistic short- and long-term forecasts.

In-depth LEO Token (UNUS SED LEO) price prediction for July 2026 — current trend, support/resistance levels, RSI, MACD, moving averages, and realistic short- and long-term forecasts.
UNUS SED LEO (LEO) is not a typical altcoin. It doesn't chase narratives, it doesn't swing 20% in a day, and it isn't trying to be the next payments network or smart contract platform. Instead, LEO functions as the utility and loyalty token of iFinex, the parent company behind the Bitfinex exchange, and its price behavior reflects that: low volatility, a tight trading range, and a value proposition tied directly to Bitfinex's ongoing buyback-and-burn program rather than pure speculation.
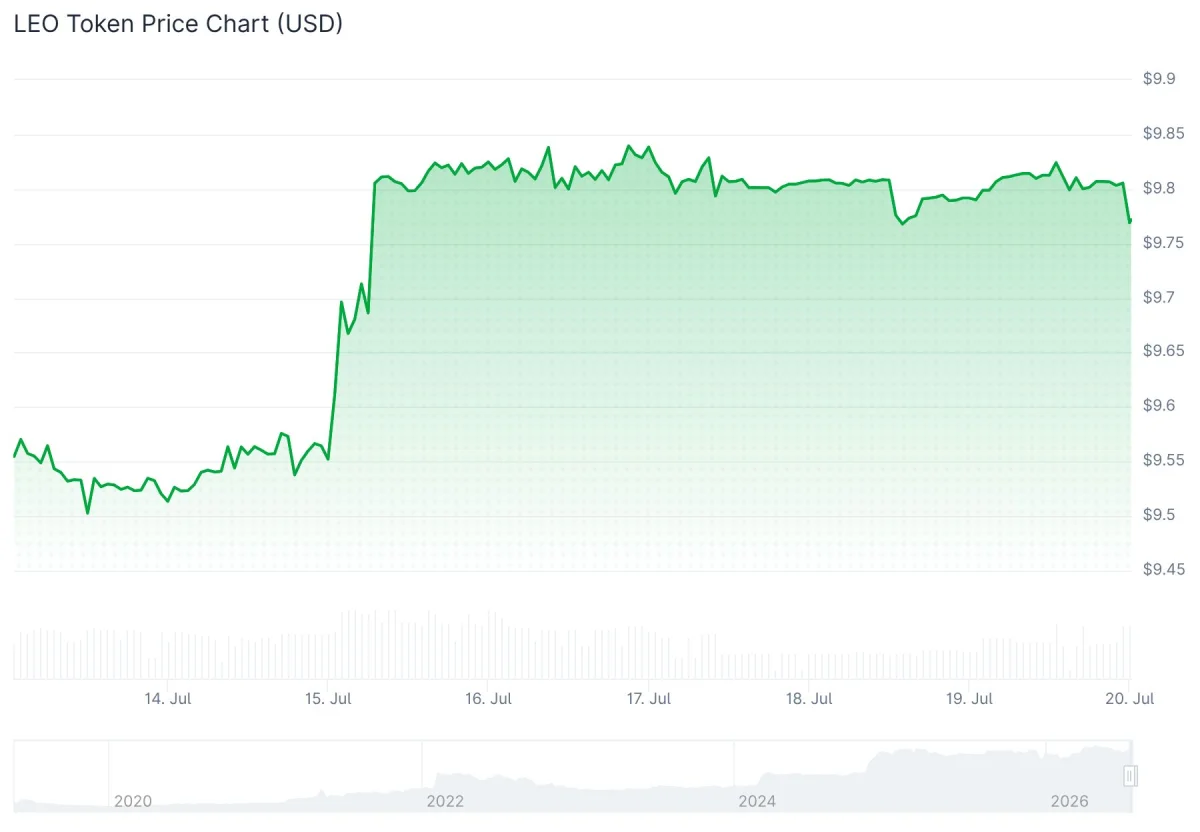
Image Source: CoinGecko
That said, "boring" doesn't mean "unimportant." For traders using Bitfinex, holders looking for fee discounts, and investors who want exposure to a token with a genuine deflationary mechanism and real cash-flow backing, understanding where LEO sits technically in July 2026 still matters. This analysis walks through the current market structure, key technical indicators, support and resistance zones, and realistic price scenarios for LEO through the rest of 2026 — without the hype that surrounds more speculative tokens.
Current Market Overview
| Metric | Approximate Value |
|---|---|
| Current Price | ~$9.60–$9.80 |
| 24-Hour Change | Roughly flat, within +/-1% |
| 7-Day Trend | Mildly positive, low single digits |
| 30-Day Performance | Range-bound, within a few percent of the month's open |
| Market Sentiment | Neutral-to-mildly-bullish |
| 24h Trading Volume | Roughly $500K–$1.1M (notably low relative to market cap) |
| Market Capitalization | Approximately $8.8–$9.5 billion |
| Circulating Supply | ~920 million LEO |
| All-Time High | $10.46 |
| All-Time Low | $0.80 (2019) |
What these numbers indicate: LEO's trading volume is strikingly small compared to its market cap — often under 0.02% of market cap changes hands daily. This is common for tokens with a large portion of supply held long-term by loyal Bitfinex users seeking fee tiers, rather than active traders. Low volume means price can be more sensitive to individual large orders, but it also means the token rarely sees the sharp, panic-driven drawdowns typical of higher-beta altcoins. The price sitting within roughly 6-10% of its all-time high says a lot on its own: LEO has spent much of its history recovering steadily rather than experiencing dramatic boom-bust cycles.
Technical Analysis
Trend Direction
The dominant read across data providers is neutral-to-bullish on the daily and weekly timeframes, though some shorter-term models flag mild bearish pressure when price dips below its short-term moving averages. In simple terms: LEO isn't trending hard in either direction — it's consolidating just below its historical ceiling, with periodic pushes toward the $9.80–$10.00 zone followed by pullbacks toward $9.20–$9.40.
This is consistent with an asset that has largely "grown into" its price. Investors aren't aggressively bidding it higher, but they're also not dumping it. That balance is the hallmark of a maturing, lower-volatility asset.
Support Levels
- Immediate support: ~$9.20–$9.40 — where dips have repeatedly found buyers over the past several weeks.
- Major support: ~$8.90–$9.00 — a psychological round-number zone and prior consolidation floor.
- Strong historical support: ~$8.00–$8.30 — the base built during 2024–2025 before LEO's climb toward its current range; a break below this would represent a meaningful structural shift.
These levels matter because each represents a price zone where past buying pressure was strong enough to reverse a decline. A break below immediate support with rising volume would be the first signal that sentiment is genuinely shifting, rather than just a routine pullback.
Resistance Levels
- Immediate resistance: ~$9.80–$9.90 — just under the psychologically significant $10 mark.
- Major resistance: ~$10.00–$10.10 — the round-number ceiling that has capped rallies multiple times.
- Breakout level: ~$10.46 (all-time high) — a confirmed close above this level would put LEO into uncharted territory for the first time since its 2019 launch.
If LEO breaks and holds above the all-time high with real volume behind it (not just a brief wick), it would likely trigger a wave of new-high headlines and could accelerate buying from momentum-driven traders, even though LEO's typical audience skews toward long-term holders rather than speculators.
Moving Averages
| Moving Average | Approximate Level | Signal |
|---|---|---|
| 20 EMA | ~$9.65 | Short-term trend, price often oscillates around it — mixed signal |
| 50 EMA | ~$9.70–$9.75 | Price near this level suggests LEO is in equilibrium, not strongly trending |
| 100 EMA | ~$9.40–$9.55 | Price above this level supports a mildly bullish medium-term bias |
| 200 EMA | ~$8.90–$9.10 | Price comfortably above this level confirms a longer-term uptrend intact since 2024 |
What this means simply: when a shorter-term average (like the 20 EMA) sits close to the longer-term ones (100 EMA, 200 EMA), it tells you the asset isn't in a strong trend — it's consolidating. LEO's moving average stack currently shows this "compressed" pattern, which often precedes a period of lower volatility followed by a decisive move once a catalyst (like a large buyback announcement or exchange-specific news) appears.
RSI Analysis
Different data providers show RSI readings ranging from the high-30s to low-70s depending on the exact timeframe and lookback period used — a reminder that RSI is sensitive to methodology. Taking the most commonly cited 14-day daily RSI readings, LEO currently sits in the neutral-to-moderately-bullish zone (roughly 50-60), not clearly overbought or oversold.
- Above 70: Overbought — LEO is not currently here on most daily readings.
- 30-70: Neutral — this is where most current readings place LEO.
- Below 30: Oversold — not applicable right now on the daily chart, though it has appeared briefly on some shorter-term charts during dips.
A neutral RSI means there's no strong technical argument for an imminent sharp reversal in either direction based on momentum alone — the next move is more likely to come from a catalyst than from indicator exhaustion.
MACD
With price consolidating close to its short- and medium-term moving averages, the MACD line and signal line have been crossing back and forth in a tight band — a classic sign of low trend strength. Small bullish crossovers (MACD line crossing above the signal line) have coincided with pushes toward $9.80-$9.90, while bearish crossovers have lined up with pullbacks toward $9.20-$9.40.
In simple terms: MACD is currently more useful for spotting short-term swing points within the range than for calling a major trend change. A decisive MACD crossover accompanied by a break of the $10 resistance or $9.00 support would carry far more weight than the choppy signals inside the range.
Bollinger Bands
LEO's Bollinger Bands have been relatively narrow recently — a direct reflection of its low realized volatility. Price has spent much of the recent period hugging the middle band, with only brief touches of the upper band near $9.80-$10.00 and the lower band near $9.20-$9.30.
Narrow bands often precede an eventual expansion — meaning a squeeze can resolve into a stronger directional move once it breaks. Given LEO's low volume, that breakout, when it comes, may be more gradual than the sharp expansions seen in higher-beta altcoins.
Volume Analysis
This is arguably the most important caveat for LEO right now: volume is thin, and it does not strongly confirm the current price structure. Daily volume in the roughly $500K-$1.1M range is small for a token with a market cap near $9 billion. This means:
- Price moves can occur on relatively light buying or selling.
- Breakouts above resistance should ideally be confirmed by a visible volume spike before being trusted.
- The token's price stability likely owes more to a large base of long-term holders (using LEO for Bitfinex fee discounts) than to active trading dynamics.
Fibonacci Analysis
Using the 2025 swing low (~$8.00) to the recent high (~$10.46) as the primary range:
- 23.6% retracement: ~$9.88
- 38.2% retracement: ~$9.52
- 50% retracement: ~$9.23
- 61.8% retracement: ~$8.94
- 78.6% retracement: ~$8.57
Current price action clustering between the 38.2% and 50% retracement levels ($9.20-$9.55) lines up closely with the support zones identified earlier, reinforcing that this is a technically significant area. A confirmed break below the 61.8% level (~$8.94) would suggest the recent uptrend structure is weakening.
Chart Patterns
Given LEO's tight, low-volatility range, the clearest pattern forming on the daily chart is a rectangle / horizontal consolidation pattern, roughly bounded between $9.20 support and $9.90-$10.00 resistance. Within that rectangle, shorter-term price swings have occasionally resembled a falling wedge on pullbacks (each dip making a slightly higher low, a mildly bullish structure) and a symmetrical triangle on some approaches toward resistance.
- A confirmed breakout above the rectangle's ceiling (with volume) would target a measured move toward the $10.40-$10.80 zone.
- A confirmed breakdown below the rectangle's floor would open room toward the $8.90-$9.00 support shelf.
No head-and-shoulders, double-top/bottom, or cup-and-handle formations are clearly visible on the current daily chart; the dominant structure remains the consolidation rectangle.
On-Chain Analysis (if applicable)
Public on-chain dashboards for LEO are less granular than for many DeFi-native tokens, since a large share of activity happens on Bitfinex's internal ledger rather than fully on-chain. That said, based on available public data:
- Buyback and burn activity: iFinex has historically allocated a meaningful share of Bitfinex's profits toward LEO buybacks, which are then burned — this is LEO's core deflationary mechanism and a key long-term price support factor.
- Exchange concentration: A significant portion of circulating LEO is held on or associated with Bitfinex itself, given its role in fee discounts.
- Token unlocks: LEO has no major scheduled unlock events remaining from its original 2019 issuance; the supply dynamic today is driven almost entirely by ongoing burns rather than new emissions.
- Developer/exchange activity: Activity tracks closely with Bitfinex's own platform announcements and quarterly buyback disclosures rather than a public GitHub-style developer cadence.
Assumption note: precise current active-address counts and whale-wallet concentration figures were not independently verifiable at the time of writing; treat any such figures found elsewhere with caution and check the source's methodology.
Market Sentiment
- Fear & Greed Index (broad crypto market): Sentiment across the wider crypto market in mid-2026 has fluctuated between Neutral and Greed, generally supportive of risk assets like LEO.
- Bitcoin dominance: Bitcoin dominance has remained a key swing factor for altcoin performance broadly; periods of falling BTC dominance have tended to coincide with modest strength across mid-cap tokens like LEO.
- Overall crypto market trend: The broader market has been characterized by rotation between risk-on and risk-off phases rather than a single sustained trend.
- Institutional activity / ETF developments: LEO itself is not a focus of spot ETF discussions (unlike BTC or ETH), so this factor is largely indirect — it affects LEO mainly through its influence on overall market liquidity and risk appetite.
- Macroeconomic factors: Interest rate expectations and general risk sentiment in traditional markets continue to spill over into crypto broadly, and LEO is not immune to those macro currents even though its own volatility is muted.
Notable Ecosystem Updates
LEO's "ecosystem" is really the Bitfinex/iFinex platform itself rather than a decentralized dApp environment, so relevant developments to watch include:
- Bitfinex's periodic buyback-and-burn disclosures, which directly affect LEO's circulating supply.
- Platform-level updates to trading fee-discount tiers tied to LEO holdings.
- Bitfinex's ongoing derivatives, lending, and margin trading offerings, which generate the revenue used to fund LEO buybacks.
- Any regulatory developments involving iFinex/Bitfinex, given the company's history with U.S. regulators, which can influence sentiment even when they don't directly touch LEO's token mechanics.
Price Prediction
All figures below are illustrative technical scenarios based on the support/resistance and indicator analysis above — not guarantees. Probabilities are qualitative estimates, not statistical certainties.
| Timeframe | Expected Range | Bullish Scenario | Neutral Scenario | Bearish Scenario | Probability Weighting | Reasoning |
|---|---|---|---|---|---|---|
| Today | $9.50-$9.85 | $9.90+ | ~$9.65 | <$9.40 | Neutral most likely (~55%) | Low volume, range-bound |
| Tomorrow | $9.45-$9.90 | Test of $9.90-$10.00 | Hold mid-range | Slip toward $9.30 | Neutral (~50%) | No clear catalyst identified |
| This Week | $9.30-$10.00 | Break toward ATH ($10.46) | Continued rectangle consolidation | Retest $9.00-$9.20 support | Neutral-to-bullish (~55% neutral, ~30% bullish) | Range highly likely to persist absent news |
| Remaining Days of Month | $9.20-$10.10 | Close above $10 | Range-bound continuation | Fibonacci 50% retest (~$9.23) | Neutral (~50%) | Month-end positioning typically light for LEO |
| Next Month | $9.00-$10.50 | New all-time high | Sideways near current levels | Drop to $8.90 major support | Neutral-to-bullish (~45% neutral, ~35% bullish) | Depends heavily on Bitfinex buyback pace and broader market risk appetite |
| 3 Months | $8.50-$11.00 | Breakout continuation toward $11+ | Range extension between $9-$10.50 | Retreat to $8.00-$8.30 zone | Wide uncertainty; roughly even bull/neutral/bear split | Longer horizon increases sensitivity to macro and exchange-specific news |
| 6 Months | $8.00-$12.00 | Sustained new highs on continued burns | Broad consolidation near $9.50-$10.50 | Correction back to 2025 support base | Wide uncertainty | Buyback cadence and crypto market cycle phase are the dominant variables |
| End of 2026 | $8.00-$13.00 | Strong burn-driven appreciation | Modest gains, ending near $10-$11 | Reversion toward $7.50-$8.50 on broader market weakness | Wide uncertainty; skewed slightly bullish given deflationary structure | LEO's buyback mechanism provides a structural tailwind absent a broader crypto downturn |
Trading Scenarios
Bullish setup: Price holds above the $9.50-$9.65 zone (20/50 EMA cluster), RSI stays above 50, and volume picks up on any push toward $9.90-$10.00 — this combination would support a case for testing the all-time high.
Bearish setup: A daily close below the $9.20-$9.40 immediate support, especially on rising volume, would suggest the rectangle's floor is failing and open room toward $8.90-$9.00.
Breakout scenario: A confirmed, volume-backed close above $10.46 (the all-time high) would represent the most significant technical event for LEO in years, potentially triggering a fresh momentum wave into price-discovery territory.
Breakdown scenario: A confirmed close below $8.90-$9.00 major support would put the 61.8% Fibonacci level and the 2025 structural low ($8.00-$8.30) back into play.
Range trading scenario: Given the current rectangle pattern and thin volume, buying near $9.20-$9.40 support and taking profit near $9.80-$9.95 resistance has been the setup most consistent with LEO's recent behavior — though any range strategy should include a stop below support in case of a genuine breakdown.
Risk Factors
- Bitcoin volatility: As with nearly all altcoins, a sharp BTC move (in either direction) tends to spill over into LEO's price, even though LEO's own volatility is typically lower.
- Macroeconomic news: Interest rate decisions and broader risk sentiment shifts can affect crypto market liquidity generally.
- Regulatory developments: iFinex/Bitfinex's regulatory history means company-specific news can move LEO sentiment independent of broader crypto trends.
- Network/platform outages: Since LEO's utility is tied directly to the Bitfinex platform, any operational issues at the exchange could affect confidence in the token.
- Profit-taking: Moves toward resistance and the all-time high are natural points for long-term holders to realize gains, which can cap rallies.
- Low liquidity: LEO's thin daily volume means larger orders can move the price more than they would for a similarly-sized, more liquid token, increasing slippage risk for larger trades.
Frequently Asked Questions
1. What is LEO Token used for? LEO is the utility and loyalty token of iFinex, the parent company of the Bitfinex exchange. Holding LEO provides tiered discounts on trading, withdrawal, and lending fees on Bitfinex.
2. Is LEO Token a good long-term investment? LEO's ongoing buyback-and-burn mechanism, funded by a share of Bitfinex's profits, provides a structural deflationary tailwind. However, its price is closely tied to Bitfinex's business performance and broader crypto market sentiment, so it carries the same general risks as any cryptocurrency investment.
3. Why does LEO have such low volatility compared to other cryptocurrencies? A large share of LEO's circulating supply is held long-term by Bitfinex users for fee-discount purposes rather than actively traded, which contributes to its comparatively narrow trading range.
4. What is LEO Token's all-time high? LEO's all-time high is approximately $10.46.
5. What is the current RSI for LEO Token? Based on the most commonly cited 14-day daily readings, LEO's RSI currently sits in a neutral range (roughly 50-60), indicating the token is neither clearly overbought nor oversold.
6. What are the key support levels for LEO right now? Immediate support is around $9.20-$9.40, with major support near $8.90-$9.00 and a stronger historical support zone around $8.00-$8.30.
7. What are the key resistance levels for LEO right now? Immediate resistance sits around $9.80-$9.90, with the psychological $10.00 level and the all-time high near $10.46 as the major breakout zones.
8. Will LEO Token reach a new all-time high in 2026? This is uncertain. A confirmed, volume-backed break above $10.46 would be needed to establish a new all-time high; current technicals show price consolidating just below that level, but no outcome is guaranteed.
9. How does LEO's buyback-and-burn mechanism work? Bitfinex allocates a portion of its trading revenue toward repurchasing LEO tokens on the open market, which are then permanently removed from circulation (burned), gradually reducing total supply over time.
10. Where can I trade LEO Token? LEO trades on Bitfinex and a number of other centralized exchanges, though it is notably unavailable on some major platforms like Coinbase and Robinhood as a tradable asset.
Conclusion
LEO Token's July 2026 technical picture is one of controlled consolidation rather than dramatic trend movement. The current trend leans neutral-to-mildly-bullish, with price holding a tight rectangle between roughly $9.20 support and $9.90-$10.00 resistance, just below its $10.46 all-time high. Moving averages are compressed rather than sharply diverging, RSI sits in neutral territory, and — critically — trading volume remains thin relative to LEO's multi-billion-dollar market cap, meaning any breakout or breakdown should be weighed against whether it's actually confirmed by real trading activity.
In the short term, range-bound behavior between support and resistance remains the most probable path absent a specific catalyst. Over the medium-to-long term, LEO's structural buyback-and-burn mechanism provides a genuine (if modest) deflationary tailwind that distinguishes it from purely speculative tokens — but it does not insulate LEO from broader crypto market cycles, Bitcoin's price action, or exchange-specific regulatory risk. Key risks to monitor include Bitcoin volatility, macroeconomic shifts, iFinex/Bitfinex-specific regulatory news, and the token's persistently low liquidity.
This analysis reflects current technical conditions and does not guarantee future price movement in either direction.
This article is for educational and informational purposes only and should not be considered financial advice. Cryptocurrency investments are highly volatile and involve significant risk.