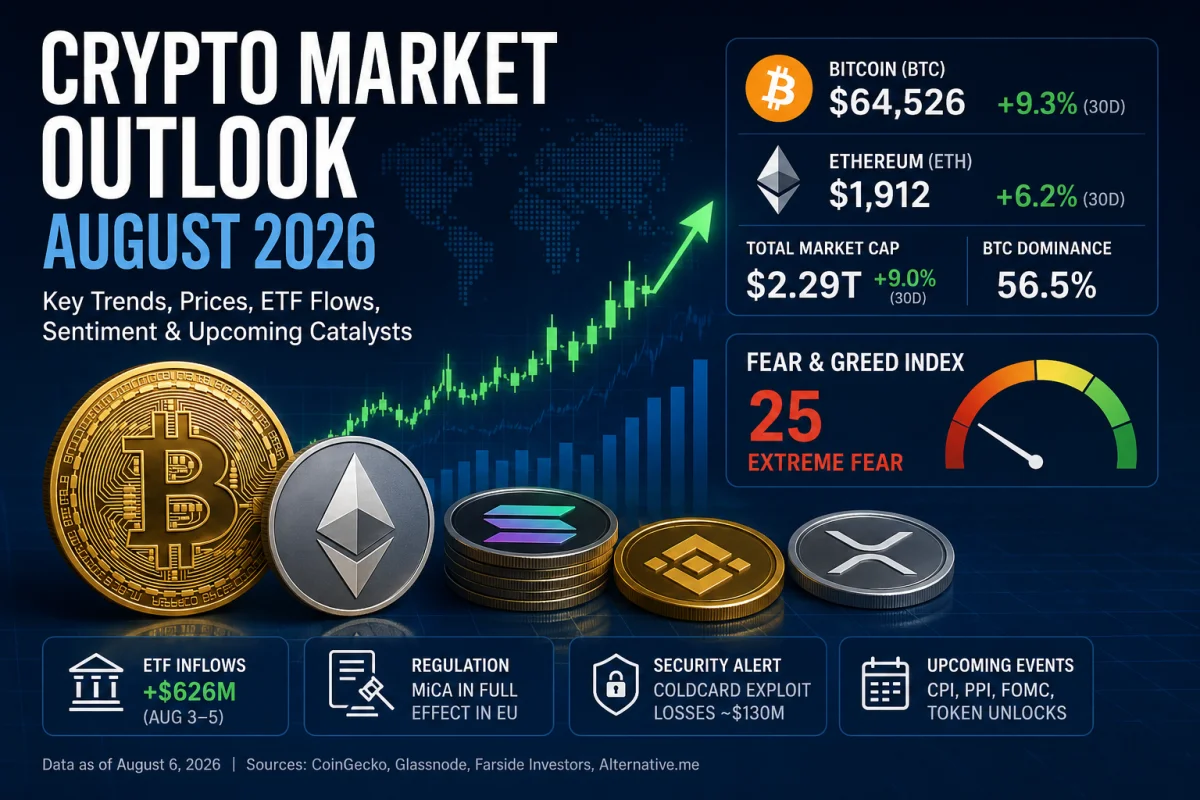
The cryptocurrency market enters August 2026 near $2.29 trillion, with Bitcoin holding above $64,000 as ETF inflows improve. This report examines prices, sentiment, on-chain trends, macro risks and the most important upcoming catalysts.

The cryptocurrency market enters August 2026 near $2.29 trillion, with Bitcoin holding above $64,000 as ETF inflows improve. This report examines prices, sentiment, on-chain trends, macro risks and the most important upcoming catalysts.
Market data cut-off: August 6, 2026. Cryptocurrency prices and performance figures can change materially after publication.
Executive Summary
- The cryptocurrency market is valued at approximately $2.29 trillion, around 9% above CoinGecko’s $2.1 trillion second-quarter closing level. Bitcoin dominance remains elevated at 56.5%, indicating that capital is still concentrated in larger assets.
- Bitcoin trades near $64,526 after gaining approximately 9.3% in July, but low spot volume and a significant on-chain cost-basis cluster between $62,000 and $68,000 suggest that the recovery has not yet developed broad conviction.
- Market sentiment remains defensive. Alternative.me’s Crypto Fear & Greed Index stands at 25, or “Extreme Fear,” while social commentary has shifted from nearly balanced in early July to distinctly bearish.
- Institutional demand is more constructive than retail positioning. U.S. spot Bitcoin ETFs attracted a combined $626 million between August 3 and August 5, although macroeconomic, regulatory and security risks remain material.
Market Overview
CoinGecko placed the total cryptocurrency market capitalization at $2.29 trillion on August 6, with approximately $53.7 billion in 24-hour trading volume. Bitcoin accounted for 56.5% of the market and Ethereum for 10.1%. CoinMarketCap simultaneously reported a lower total market value of approximately $2.20 trillion and higher Bitcoin dominance of 58.8%, reflecting differences in token classifications and circulating-supply methodologies. This report uses CoinGecko figures for consistency.
The market has recovered approximately 9% from CoinGecko’s $2.1 trillion capitalization at the end of the second quarter. However, the improvement in asset prices has not been matched by a comparable expansion in trading participation; CoinGecko documented falling centralized-exchange and stablecoin activity during the second quarter, while Glassnode reported on July 29 that Bitcoin spot volume had fallen to its lowest level since 2019.
Bitcoin Price Action
Bitcoin traded near $64,526 at the August 6 cut-off, with a market capitalization of approximately $1.295 trillion. Its rolling 30-day gain was only 1.0%, although the asset completed July with an estimated 9.3% monthly return, demonstrating the difference between calendar-month and rolling performance measurements. K33 Research estimated average daily Bitcoin spot volume at only about $2.2 billion during July.
The principal support area is between $62,000 and $63,000, where Glassnode identified one of the market’s heaviest cost-basis shelves. The broader $62,000–$68,000 zone contains substantial investor positioning, while the short-term-holder cost basis near $69,000 represents the most important resistance level. A sustained move above $69,000 would improve the technical structure; failure to defend $62,000 would expose the psychological $60,000 level.
Ethereum and the ETH/BTC Ratio
Ethereum traded at approximately $1,912, giving it a market value of $230.7 billion. ETH gained 6.2% over 30 days, outperforming Bitcoin’s 1.0% advance, while the ETH/BTC ratio stood near 0.0296, calculated from current CoinGecko prices. The ratio’s recovery toward 0.03 indicates improving relative strength, but it remains too weak to confirm a sustained rotation away from Bitcoin.
Bitcoin, Ethereum and Leading Altcoin Performance
| Asset | Price | Market Cap | 24h | 7d | 30d |
|---|---|---|---|---|---|
| Bitcoin (BTC) | $64,525.63 | $1.295T | 0.0% | +0.3% | +1.0% |
| Ethereum (ETH) | $1,911.65 | $230.70B | +1.0% | +0.3% | +6.2% |
| BNB (BNB) | $592.63 | $78.92B | +1.0% | +0.1% | +1.3% |
| XRP (XRP) | $1.04 | $65.15B | +2.4% | +4.4% | +7.8% |
| Solana (SOL) | $73.14 | $42.52B | +1.5% | +1.9% | +11.0% |
| TRON (TRX) | $0.3268 | $31.01B | +0.4% | +0.7% | +1.7% |
| Hyperliquid (HYPE) | $56.16 | $12.49B | +2.2% | +2.5% | +21.5% |
| Dogecoin (DOGE) | $0.06907 | $10.73B | +1.5% | +2.1% | +8.3% |
| LEO Token (LEO) | $9.76 | $8.98B | +0.1% | +0.2% | +4.1% |
| Zcash (ZEC) | $496.13 | $8.33B | +4.8% | +4.8% | +1.8% |
| Cardano (ADA) | $0.2066 | $7.72B | +7.1% | +19.9% | +15.3% |
| Monero (XMR) | $365.79 | $6.87B | +3.2% | +2.3% | +9.2% |
Selection follows CoinMarketCap’s August 6 non-stablecoin ranking, while prices, capitalization and performance figures use CoinGecko’s consistent 30-day dataset. Data-provider rankings can differ because of circulating-supply treatment, particularly for HYPE and newer assets.
Market Sentiment Analysis
Alternative.me’s Crypto Fear & Greed Index registered 25, or Extreme Fear, on August 6. The reading was 27 one day earlier, 28 one week earlier and 27 one month earlier, showing that sentiment has remained persistently defensive rather than experiencing a brief panic event.
Social positioning has deteriorated more visibly. Santiment measured approximately 1.06 bullish comments for every bearish comment on July 10, indicating a nearly neutral market. By August 4, the positive-to-negative commentary ratio had fallen to 0.54, reflecting a clear bearish shift following the Coldcard security incident and renewed price uncertainty.
Institutional positioning is comparatively stronger. U.S. spot Bitcoin ETF demand rebounded sharply in early August even as retail engagement and spot-market participation remained weak. This divergence should be interpreted as selective institutional accumulation—not yet as confirmation of a broad, market-wide risk-on cycle.
Key Developments This Month
Regulatory Developments
The U.S. Digital Asset Market Clarity Act remained unresolved as of August 6. Senate leadership had not initiated the required cloture process before the scheduled August 7 recess, while disagreements persisted over political ethics, stablecoin rewards, decentralized finance and enforcement provisions. Consideration could resume in September, but the limited pre-election calendar increases execution risk.
In Europe, the MiCA transitional period ended on July 1, 2026. The Financial Times reported on August 6 that 323 firms had obtained authorization while more than 1,700 unlicensed entities faced closure, relocation or an orderly withdrawal from EU markets. ESMA has instructed unauthorized providers to wind down while protecting customer assets, making MiCA implementation an immediate operational issue rather than a future compliance exercise.
The CFTC also extended its public-comment period on July 23 for proposed rules involving 24-hour futures trading and perpetual contracts. Although broader than digital assets alone, the process could influence how continuously traded derivatives are incorporated into regulated U.S. markets.
Institutional and ETF Flows
Farside Investors recorded U.S. spot Bitcoin ETF inflows of $170.1 million on August 3, $211.5 million on August 4 and $244.4 million on August 5. The three-session total reached $626 million, with BlackRock’s IBIT providing most of the demand.
Morgan Stanley Investment Management launched the MSSE Ethereum Trust and MSOL Solana Trust on July 28. Both products charge a 0.14% expense ratio and intend to stake part of their underlying assets. Morgan Stanley’s existing Bitcoin product held more than $381 million through July 16, demonstrating continued expansion by bank-affiliated asset managers despite subdued market conditions.
Exchange and Security Risks
Coinbase reported its third consecutive quarterly loss on July 31, although its crypto-trading market share reached a record 10.3%. The result highlighted the difficult volume environment while also showing that larger regulated exchanges continue gaining share from weaker competitors.
The most significant security event involved predictable seed phrases generated by affected Coldcard firmware. Coinkite issued its advisory on July 30 and released fixed firmware, but affected users were required to create new seeds and migrate funds. Public loss estimates increased from approximately $89 million on August 1 to roughly $130 million by August 4, indicating that attribution and total exposure were still evolving.
On-Chain and Macro Context
Glassnode’s July 22 and July 29 reports showed fading exchange inflows, quiet spot activity and accumulation concentrated mainly among wallets holding 1,000–10,000 BTC. Broader investor cohorts were not accumulating at the same rate, meaning that the recovery lacked the participation breadth normally associated with a durable expansion.
Stablecoin capitalization stood near $302 billion, compared with $309.9 billion at the end of the first quarter. The contraction is important because stablecoins represent deployable crypto-native liquidity; declining supply can limit the capital available to sustain altcoin rallies.
The Federal Reserve held its target rate at 3.50%–3.75% on July 29 in a 9–3 vote, with three dissenters preferring a 25-basis-point increase. June CPI fell 0.4% month over month, while headline inflation remained 3.5% year over year and core inflation stood at 2.6%. The June PCE index was still higher at 3.7%, with core PCE at 3.3%, leaving policy restrictive despite improving monthly CPI data.
The U.S. Dollar Index traded near 99.98 on August 6 after touching a six-week low earlier in the week. A sustained decline in the dollar would generally improve liquidity conditions for crypto assets, but stronger employment or inflation data could rebuild expectations for a September rate increase.
Upcoming Catalysts and What to Watch
- August 7 — U.S. employment report: Labor-market strength will influence September rate expectations and the dollar.
- August 10 — Kraken delistings: Trading and deposits for 21 affected assets will be disabled at 14:00 UTC, creating token-specific liquidity risk.
- August 12–13 — U.S. CPI and PPI: These releases will determine whether June’s inflation improvement continued into July.
- August 16 — Arbitrum unlock: ARB allocated to the DAO Treasury becomes available, requiring monitoring for distribution or deployment activity.
- August 26 — U.S. PCE release: The Fed’s preferred inflation measure will provide the final major inflation signal before the September meeting.
- August 26–27 — ETH Belgrade: Ethereum developers and infrastructure providers will meet ahead of the September conference cycle, potentially generating upgrade and ecosystem announcements.
- August 28 — SIGN unlock: A scheduled backer allocation may increase circulating supply and short-term volatility.
- September 1 — Sui unlock: Community Reserve tokens are scheduled for release; only about 40.7% of total SUI supply was unlocked as of August 6.
- September 11 and September 15–16 — CPI and FOMC: The inflation report will arrive four days before the Federal Reserve’s policy decision and updated economic projections.
Top 3 Coins to Watch
1. Bitcoin
Bitcoin remains the primary indicator of market liquidity. ETF inflows are supportive, but the decisive confirmation level is $69,000. A breakout must be accompanied by expanding spot volume rather than ETF demand alone.
2. Ethereum
Ethereum has outperformed Bitcoin over 30 days, while the ETH/BTC ratio is approaching 0.03. A sustained move above that ratio, together with stronger demand for staking-enabled institutional products, would support a broader capital rotation.
3. Solana
Solana gained approximately 11% over 30 days and now has a Morgan Stanley-sponsored ETP that intends to stake part of its holdings. SOL remains a higher-beta asset, however, and would be vulnerable if Bitcoin loses its $62,000 support zone.
Analyst Outlook
The short-term base case remains neutral to cautiously constructive, with Bitcoin likely to continue trading inside the $62,000–$69,000 decision range until spot-market participation improves.
The bullish scenario requires a sustained close above $69,000, continued positive ETF flows and a measurable recovery in spot volume. Glassnode identified relatively limited accumulated supply above that threshold until approximately $84,000, meaning a confirmed breakout could produce a faster move through the intermediate range.
The bearish scenario would be activated by a decisive break below $62,000, particularly if accompanied by ETF outflows, stronger-than-expected inflation or a DXY move above 100. Under those conditions, Bitcoin could revisit the high-$50,000 region, while Ethereum and higher-beta altcoins would probably experience larger percentage declines.
Over the medium term, regulated investment products, tokenization initiatives and clearer policy frameworks remain constructive structural factors. Nevertheless, shrinking stablecoin liquidity, low trading activity, unresolved U.S. legislation and persistent security incidents prevent the current recovery from qualifying as a confirmed new bull-market phase.
Glossary
- BTC dominance: Bitcoin’s share of total cryptocurrency market capitalization.
- ETH/BTC ratio: Ethereum’s price expressed in Bitcoin, used to measure relative performance.
- ETF net flow: Capital entering an ETF minus capital leaving it during a specified period.
- Short-term-holder cost basis: The average acquisition price of relatively recent Bitcoin buyers.
- Stablecoin supply: The total market value of crypto tokens designed to track fiat currencies.
- Token unlock: The scheduled release of previously restricted tokens into circulating supply.
- DXY: An index measuring the U.S. dollar against six major currencies.
- PCE: The Personal Consumption Expenditures price index, the Federal Reserve’s preferred inflation measure.
Risk Disclaimer
This report is provided for informational and analytical purposes only and does not constitute investment, financial or trading advice. Cryptocurrency markets are highly volatile, and investors may lose some or all of their invested capital.
— Digital Assets Market Analysis Desk