
SOL trades near $75 despite record ETF inflows and rising network usage. See why price and fundamentals are diverging, plus key levels to watch.

SOL trades near $75 despite record ETF inflows and rising network usage. See why price and fundamentals are diverging, plus key levels to watch.
A simple breakdown of where SOL stands right now, the ETF inflow story that doesn't match the price action, and what to watch next.
Quick Snapshot
Daily timeframe
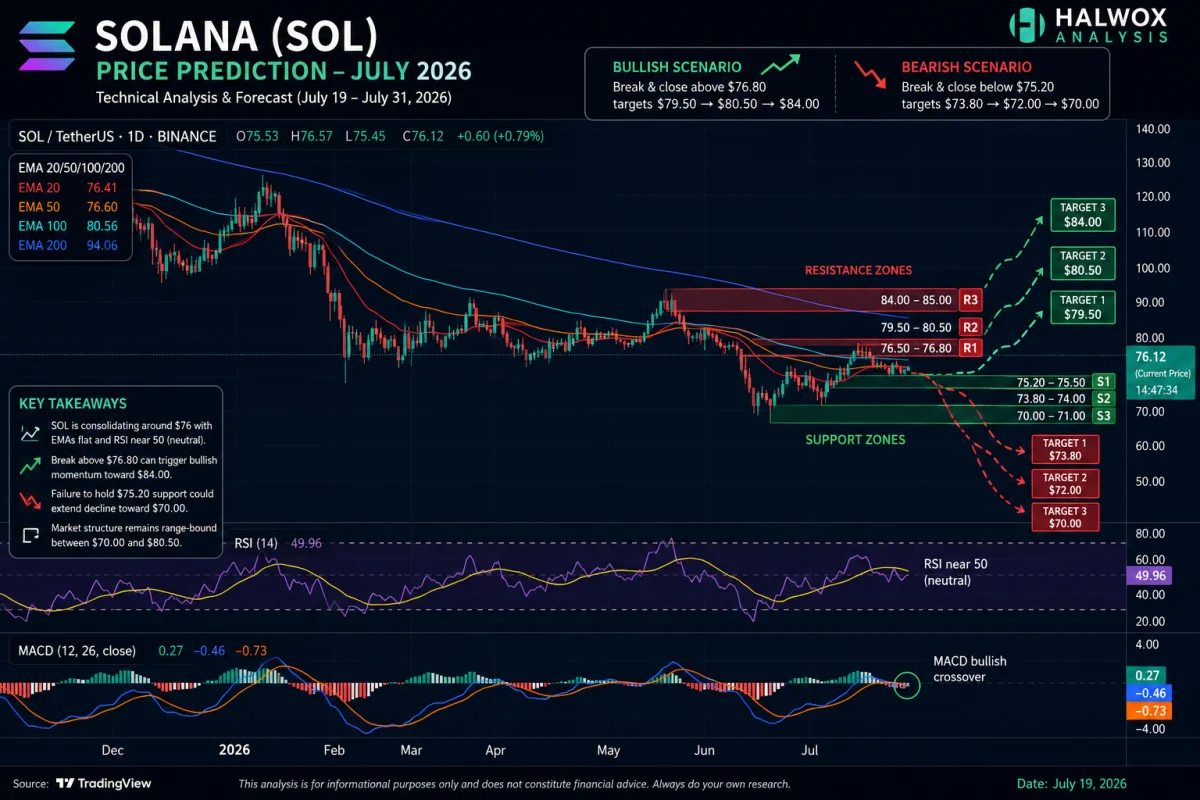
- SOL is trading around $76.1.
- Price is below the 100 EMA (~80.6) and 200 EMA (~94.1), so the long-term trend is still bearish.
- The 20 EMA and 50 EMA are almost flat around $76.4–76.6, indicating consolidation rather than a strong trend.
- RSI is ~50, showing neutral momentum with no overbought or oversold conditions.
4H timeframe
- Price has reclaimed the 20 EMA and is attempting to move above the 50/100/200 EMAs clustered between $76.1–76.5.
- RSI has climbed above 50, which slightly favors buyers.
- MACD has just produced a bullish crossover, but the histogram is still small, so confirmation is needed.
Overall, the charts suggest sideways-to-slightly bullish conditions rather than the start of a major breakout.
What Is Solana?
Solana is a high-speed Layer 1 blockchain launched in 2020, built to handle a large volume of transactions quickly and cheaply. It's become one of the main hubs for decentralized apps, NFTs, memecoin trading, and — increasingly in 2026 — tokenized real-world assets (like tokenized stocks and money-market funds). SOL is the network's native token, used to pay transaction fees and to stake and help secure the network.
Solana has positioned itself as one of the more "usable" blockchains for everyday activity, competing directly with Ethereum for developer and user attention on the basis of speed and lower fees.
The Big Story Right Now: A Price/ETF Disconnect
The most interesting thing about SOL in mid-2026 isn't really the price — it's the gap between the price and everything else happening around it.
On one hand, the price looks weak. SOL has been trading roughly 57% below where it was priced when its US spot ETFs launched in October 2025, and it's been grinding sideways in a fairly tight range (roughly $63–$80) for weeks. Several key moving averages — the 50-day, 100-day, and especially the 200-day — sit well above the current price, which technically points to a longer-term downtrend still in place.
On the other hand, the fundamentals look unusually strong for a coin whose price is struggling:
- ETF inflows have been remarkably consistent. US spot Solana ETFs recorded net inflows on every single trading day in the first weeks of July 2026 — a streak that stood out because, during that same stretch, Bitcoin ETFs were bleeding money (over $500 million in outflows in one week alone) and Ethereum ETFs saw net redemptions too. Cumulative inflows into Solana ETFs have now passed $1 billion since their October 2025 launch.
- Solana ETFs come with a built-in staking yield (around 5–7% annually), something Bitcoin and Ethereum ETFs still don't offer. That means institutional holders are effectively getting paid to wait, even while the price sits flat — a structural feature that makes Solana's ETF product different from the others on the market.
- On-chain activity is near yearly highs. The number of active addresses on Solana is retesting highs close to 7 million, and network throughput (transactions per second) has been climbing toward roughly 1,100, approaching new records for the chain.
- Real-world asset (RWA) adoption is accelerating. Solana has become the leading blockchain by number of RWA holders, crossing over 300,000 — about 31% of all tracked holders across chains, ahead of both Ethereum and BNB Chain. The value of tokenized assets on Solana reportedly quadrupled in the first half of 2026, past $3.6 billion, helped by institutional players like BlackRock deploying funds (such as its BUIDL product) on the network.
- Fee competition among ETF issuers is heating up. Grayscale cut its Solana Staking ETF sponsor fee from 0.35% to 0.19% in late June 2026, a sign that ETF providers are actively competing for this market rather than treating it as an afterthought.
This is the puzzle at the center of most SOL discussions right now: usage, adoption, and institutional product demand all look healthy, while the price itself hasn't caught up.
What's Weighing the Price Down
Token unlock supply. New SOL entering circulation through unlocks has been acting as a steady counterweight to ETF buying — every month, some of that inflow demand gets absorbed just by new supply hitting the market, rather than pushing price higher.
Treasury company buying has dried up. Digital asset treasury companies (DATCOs) — corporate entities that bought SOL to hold on their balance sheets — were active earlier in the cycle but have gone largely quiet since late 2025, weighed down by their own shares trading below net asset value, limiting their ability to raise fresh capital to buy more SOL.
Broader market mood. Sentiment across crypto has leaned toward "Fear" for stretches of 2026, and Bitcoin has continued to dominate capital flows during risk-off periods, which tends to leave money in mid-cap alts like SOL waiting on the sidelines even when their own fundamentals look fine.
Key Technical Levels to Watch
Resistance
- $76.50–76.80 (immediate)
- $79.50–80.50
- $84–85
Support
- $75.20
- $73.80
- $70.00
- Resistance: The $76–$82 zone has been the ceiling SOL has struggled to clear. Above that, analysts point to $90 as the next real signal of a shift in momentum, and a stretch goal of $125–$130 if SOL can flip $77 into support and hold it.
- Support: The $71–$73 zone (roughly matching the 200-day moving average) has been the key floor. A clean break below $71 opens the door toward the $63–$70 area.
- The bigger picture: Some longer-timeframe technical views point to $233 and even $450 as multi-month targets if SOL can reclaim higher support zones — but these are framed explicitly as longer-range scenarios, not something likely to play out within a single month.
Forecast for the rest of July 2026
Since no technical analysis can reliably predict the exact closing price for each future day, I recommend presenting these as expected trading ranges rather than exact prices. That's both more accurate and more credible.
| Date | Expected Range | Bias |
|---|---|---|
| Jul 19 | $75.8–76.8 | Neutral |
| Jul 20 | $76.0–77.2 | Slightly Bullish |
| Jul 21 | $76.5–77.8 | Bullish |
| Jul 22 | $76.8–78.2 | Bullish |
| Jul 23 | $76.5–78.0 | Bullish |
| Jul 24 | $76.2–77.9 | Neutral |
| Jul 25 | $75.8–77.5 | Neutral |
| Jul 26 | $75.5–77.2 | Neutral |
| Jul 27 | $75.8–77.8 | Slightly Bullish |
| Jul 28 | $76.5–78.5 | Bullish |
| Jul 29 | $77.0–79.0 | Bullish |
| Jul 30 | $77.5–79.5 | Bullish |
| Jul 31 | $78.0–80.0 | Bullish |
This reflects the current technical structure rather than claiming precise future prices.
Simple Bull vs. Bear Case
The bull case: Solana has quietly become the ETF category attracting the most consistent inflows in crypto, even while its price lags — that's the kind of divergence that sometimes resolves upward once unlock pressure eases or a fresh catalyst arrives. Add in genuine leadership in the RWA space and rising network usage, and there's a real fundamentals-based case that the current price doesn't reflect the network's actual growth.
The bear case: Price is the final scoreboard, and right now it's telling a cautious story — a multi-month downtrend, moving averages stacked bearishly above the market, and a token supply schedule that keeps diluting demand. ETF inflows and staking yield are nice for holders, but they haven't been enough on their own to break the current range, and there's no guarantee they will be until the unlock overhang clears or broader crypto sentiment improves.
Bullish scenario
If SOL breaks and closes above $76.8–77.0 with increasing volume, buyers could target:
- $79.5
- $80.5
- $84
Bearish scenario
If support at $75.2 fails, sellers may push SOL toward:
- $73.8
- $72
- $70
Simple Takeaway
Solana right now is a "believe the fundamentals or believe the chart" situation. The network is doing real things — record-level usage, leadership in tokenized real-world assets, and the most resilient ETF inflow streak of any major crypto category in July — while the price itself has been flat-to-down for months. That kind of gap usually closes eventually, one way or the other: either the price catches up to the fundamentals, or the fundamentals turn out not to matter as much as hoped in the current market. Anyone considering SOL should watch the $71–$73 support zone closely, keep an eye on the unlock schedule through Q3, and treat any of the more ambitious upside price targets as scenarios, not certainties.
This analysis is for informational purposes only and is not financial advice. Crypto markets are highly volatile — always do your own research before investing.