Dogecoin remains under selling pressure after breaking below important support levels. This article provides a complete technical analysis of DOGE using the 4-hour, daily, weekly, and monthly charts. We also examine key support and resistance levels, explain technical indicators in simple terms, and share short-term and long-term Dogecoin price predictions to help investors understand the current market outlook.

Dogecoin remains under selling pressure after breaking below important support levels. This article provides a complete technical analysis of DOGE using the 4-hour, daily, weekly, and monthly charts. We also examine key support and resistance levels, explain technical indicators in simple terms, and share short-term and long-term Dogecoin price predictions to help investors understand the current market outlook.
Dogecoin (DOGE) Short-Term Price Prediction
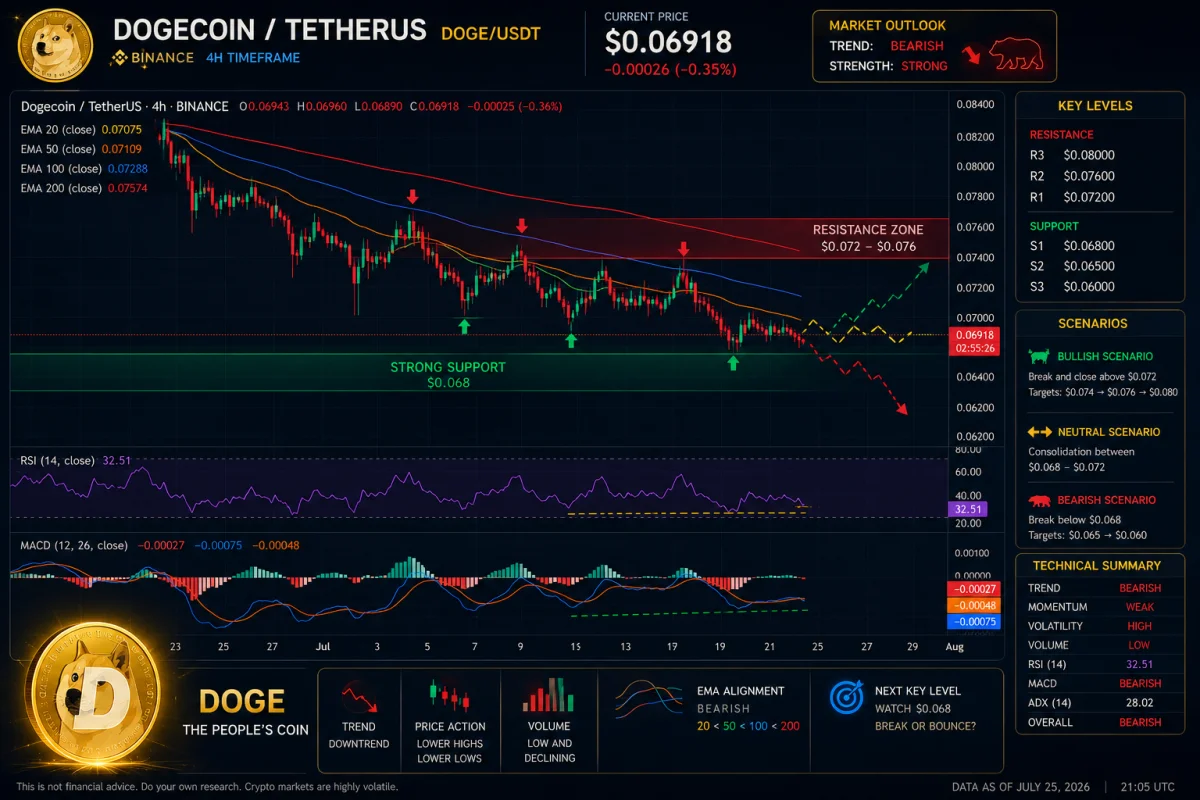
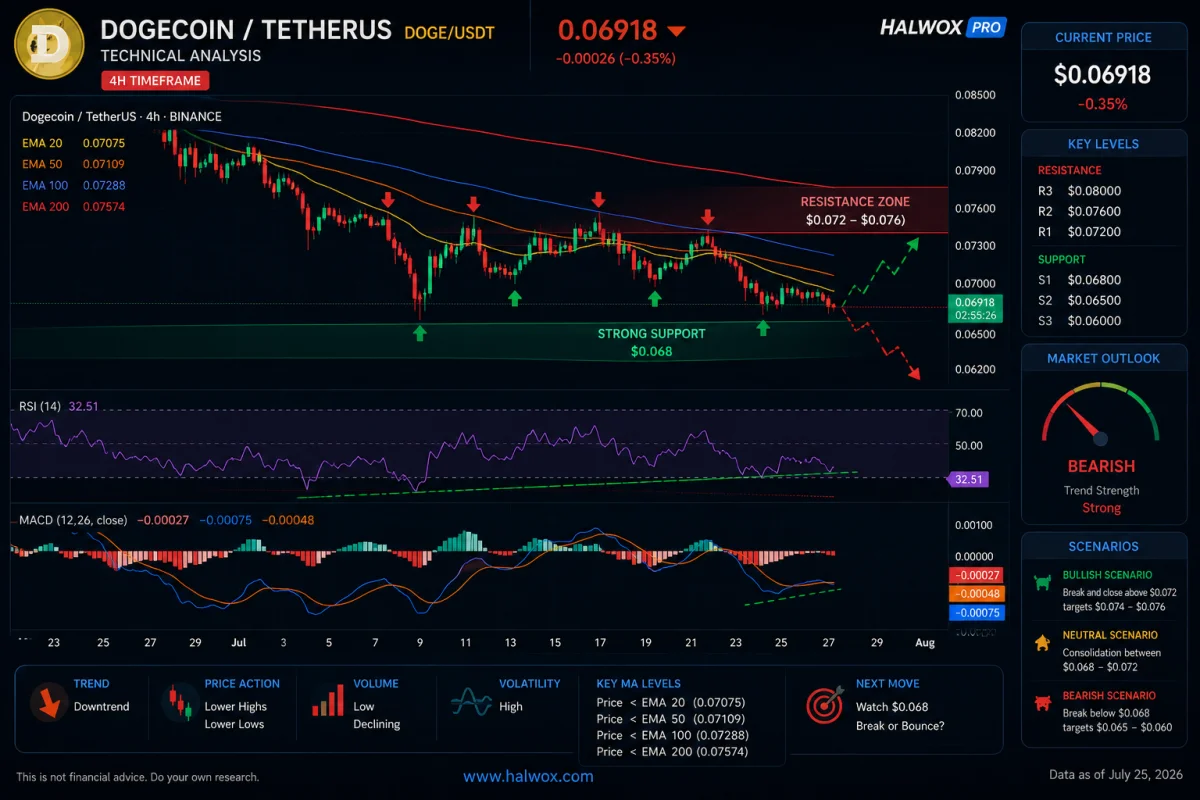
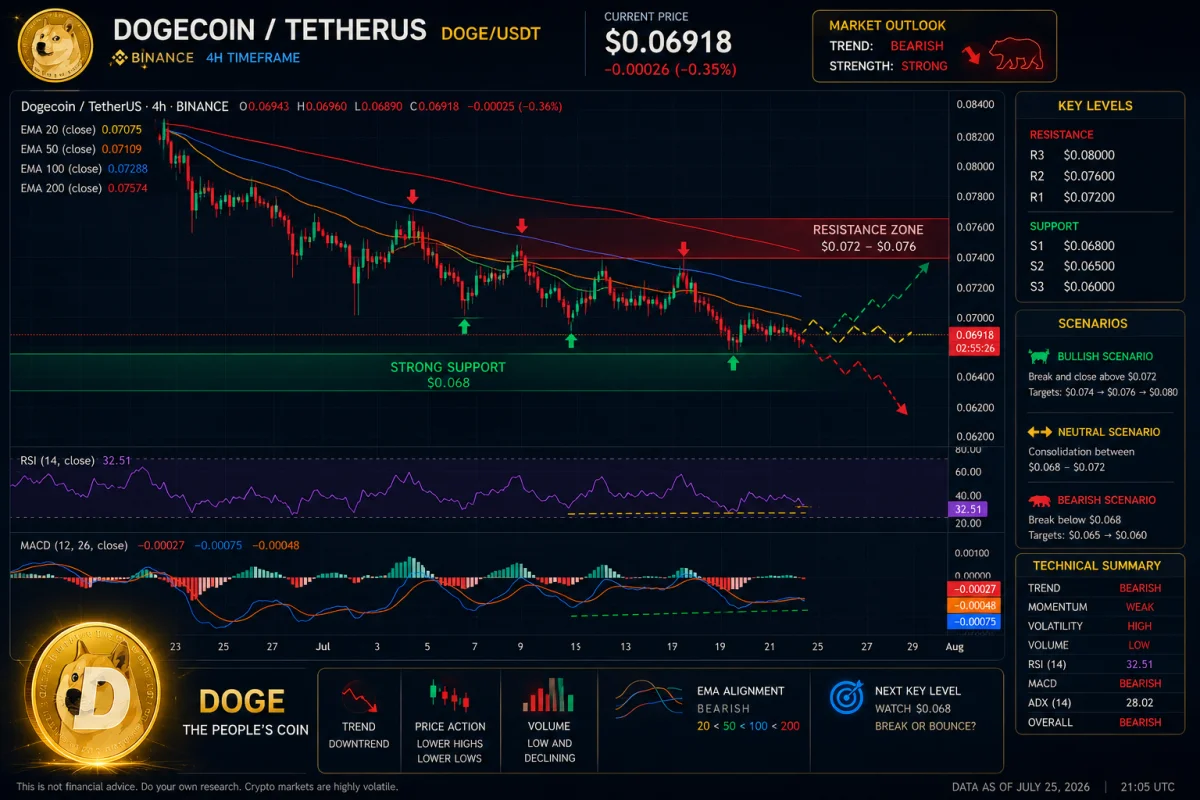
Dogecoin remains under strong selling pressure across the lower timeframes. The 4-hour chart shows that sellers are still in control after a sharp breakdown below key support near $0.072–$0.073. Price is trading below all major moving averages, which usually signals that the current trend remains bearish until buyers regain momentum.
Although the overall trend is negative, the Relative Strength Index (RSI) is approaching oversold territory. This means the selling pressure could slow down, allowing DOGE to experience a short-term relief rally before deciding its next major direction.
For traders, it is important to watch whether DOGE can reclaim the 20 EMA on the 4-hour chart. A move above this level could encourage buyers to test higher resistance levels. However, failure to break above nearby resistance may result in another wave of selling.
Dogecoin Daily Price Prediction (Remaining Days of July)
| Date | Expected Price Range | Expected Trend | Confidence |
|---|---|---|---|
| July 26 | $0.0685 – $0.0705 | Bearish | High |
| July 27 | $0.0680 – $0.0710 | Sideways | Medium |
| July 28 | $0.0685 – $0.0715 | Sideways | Medium |
| July 29 | $0.0690 – $0.0720 | Slight Recovery | Medium |
| July 30 | $0.0695 – $0.0725 | Neutral | Medium |
| July 31 | $0.0700 – $0.0730 | Mild Bullish if resistance breaks | Medium |
Note: These ranges are technical estimates based on the current chart structure and should not be considered guaranteed future prices.
DOGE Weekly Outlook
Bullish Scenario
For Dogecoin to shift toward a bullish trend, buyers need to:
- Hold support above $0.068
- Break above $0.072
- Close above the 20 EMA on the 4-hour chart
- Generate higher trading volume
- Form higher highs and higher lows
If these conditions are met, DOGE could move toward:
- $0.074
- $0.076
- $0.078
- $0.080
Neutral Scenario
If buyers and sellers remain balanced, DOGE may continue trading within a narrow range.
Expected trading range:
$0.068–$0.072
This type of price action often appears before a stronger breakout or breakdown.
Bearish Scenario
If selling pressure continues and support fails, Dogecoin could revisit lower price zones.
Potential downside targets include:
- $0.067
- $0.065
- $0.062
A break below these levels could increase market fear and delay any meaningful recovery.
Technical Indicators Explained
Relative Strength Index (RSI)
The RSI on both the 4-hour and daily charts remains close to the oversold region. While this reflects weak buying momentum, it also suggests that selling pressure may begin to slow if buyers step in.
MACD
The MACD remains bearish on the shorter timeframes. This indicates that momentum still favors sellers, although the histogram is beginning to flatten, which may hint at weakening bearish momentum.
Exponential Moving Averages (EMA)
DOGE is trading below its:
- EMA 20
- EMA 50
- EMA 100
- EMA 200
This alignment is one of the strongest signs that the short-term trend remains bearish.
ADX (Average Directional Index)
The ADX remains above 25 on multiple timeframes, indicating that the current trend is relatively strong. Since the bearish directional indicator (-DI) is higher than the bullish indicator (+DI), sellers continue to control the market.
Market Sentiment
Current sentiment around Dogecoin remains cautious.
Several factors are contributing to the weak outlook:
- Falling momentum across most timeframes
- Lower trading highs
- Weak buying volume
- Strong resistance overhead
However, the longer-term monthly chart shows that DOGE is approaching an important historical support area. This means long-term investors may begin watching for signs of accumulation if price stabilizes.
Key Levels to Watch
Immediate Support
- $0.068
- $0.067
- $0.065
Immediate Resistance
- $0.072
- $0.074
- $0.076
- $0.080
A daily close above resistance would improve the short-term outlook, while a break below support could lead to another leg lower.
Risks That Could Affect DOGE Price
Several external factors may influence Dogecoin's price in the coming weeks:
- Bitcoin volatility
- Overall cryptocurrency market sentiment
- Regulatory developments
- Macroeconomic news, including interest rate decisions
- Large holder (whale) buying or selling activity
- Increased or reduced social media interest in meme coins
Because Dogecoin is highly sentiment-driven, sudden news events can lead to sharp price swings.
DOGE Price Prediction 2026–2035: Long-Term Forecast
Dogecoin has been one of the most recognizable cryptocurrencies since its launch in 2013. While it started as a meme coin, it has grown into a widely traded digital asset with a strong community and support from major exchanges. However, like most cryptocurrencies, DOGE remains highly volatile.
Based on the monthly and weekly charts you shared, Dogecoin is trading near a long-term support zone after a prolonged downtrend. Historically, this type of price action has often been followed by either a period of accumulation or another sharp move lower. The next few months will be important in determining which direction the market chooses.
It is worth remembering that long-term price predictions are estimates, not guarantees. Market conditions, regulations, adoption, and the performance of Bitcoin can all influence DOGE's future price.
Dogecoin Price Prediction 2026
2026 could be a recovery year if the broader crypto market improves. Buyers would need to push DOGE back above the major moving averages and establish higher highs on the weekly chart.
| Scenario | Expected Price |
|---|---|
| Bearish | $0.05 |
| Average | $0.09 |
| Bullish | $0.15 |
Outlook
If Bitcoin enters another bullish phase, Dogecoin may benefit from renewed investor interest. However, failure to hold long-term support could delay recovery.
Dogecoin Price Prediction 2027
By 2027, market maturity and adoption may become stronger drivers than social media hype. If Dogecoin continues to expand its real-world use cases, its price could stabilize.
| Scenario | Expected Price |
|---|---|
| Bearish | $0.08 |
| Average | $0.16 |
| Bullish | $0.25 |
Dogecoin Price Prediction 2028
The 2028 Bitcoin halving cycle could improve sentiment across the cryptocurrency market. Historically, altcoins have often followed Bitcoin's long-term trend.
| Scenario | Expected Price |
|---|---|
| Bearish | $0.10 |
| Average | $0.22 |
| Bullish | $0.35 |
Dogecoin Price Prediction 2029
If institutional participation in cryptocurrencies continues to grow, Dogecoin could see increased liquidity and stronger price stability.
| Scenario | Expected Price |
|---|---|
| Bearish | $0.14 |
| Average | $0.30 |
| Bullish | $0.50 |
Dogecoin Price Prediction 2030
Many analysts expect the cryptocurrency industry to be significantly larger by 2030 if adoption continues. Under favorable conditions, DOGE could revisit higher price levels.
| Scenario | Expected Price |
|---|---|
| Bearish | $0.18 |
| Average | $0.42 |
| Bullish | $0.75 |
Dogecoin Price Prediction 2035
Making forecasts this far ahead is highly uncertain. Instead of focusing on one specific number, investors should consider a range of possible outcomes.
| Scenario | Expected Price |
|---|---|
| Bearish | $0.25 |
| Average | $0.70 |
| Bullish | $1.20 |
A move above $1.00 would likely require broad cryptocurrency adoption, sustained investor demand, and continued relevance for Dogecoin within the digital asset ecosystem.
Is Dogecoin a Good Investment?
Dogecoin can be attractive to investors who are comfortable with high volatility. It has strong brand recognition, an active community, and high liquidity compared to many meme coins.
However, it also carries significant risks.
Reasons investors like DOGE
- Strong global community
- Listed on major exchanges
- High daily trading volume
- Widely recognized meme coin
- Potential to benefit during bullish crypto cycles
Risks to consider
- High price volatility
- Limited utility compared with some blockchain platforms
- Heavy reliance on market sentiment
- Sensitive to Bitcoin's price movements
- Frequent sharp corrections
Investors should only invest money they can afford to lose and should diversify rather than relying on a single cryptocurrency.
Frequently Asked Questions
What is Dogecoin?
Dogecoin is a decentralized cryptocurrency that was created in 2013. It began as a joke but has become one of the world's most traded digital assets.
Is Dogecoin a good investment in 2026?
It depends on your risk tolerance. DOGE offers potential upside but also experiences large price swings.
Can Dogecoin reach $1?
It is possible over the long term, but it would require strong market conditions, increased adoption, and sustained demand. There is no guarantee this level will be reached.
Why is Dogecoin falling?
Current weakness is mainly due to bearish market sentiment, declining momentum, and broader cryptocurrency market pressure.
Can Dogecoin recover?
Yes, recoveries are possible if buyers regain control and the overall crypto market strengthens.
What are the biggest risks?
High volatility, regulatory changes, weak market sentiment, and declining investor interest.
Does Bitcoin affect Dogecoin?
Yes. Bitcoin often influences the direction of the entire cryptocurrency market, including DOGE.
What indicators should traders watch?
- RSI
- MACD
- EMA 20, 50, 100, and 200
- Support and resistance
- Trading volume
- ADX
Is DOGE in a bull market?
Based on the charts provided, the long-term trend remains bearish, although the monthly chart is approaching an important support area.
What is the biggest resistance level?
The nearest resistance is around $0.072–$0.076, while stronger resistance appears closer to the longer-term moving averages.
Final Thoughts
Dogecoin remains under pressure across the 4-hour, daily, and weekly charts. Sellers continue to dominate, with the price trading below all major moving averages and momentum indicators still favoring the bears.
Even so, the monthly chart shows DOGE nearing a historically important support zone. If buyers successfully defend this area, the market could begin a period of accumulation before any sustained recovery.
In the short term, traders should monitor whether DOGE can reclaim resistance around $0.072–$0.076. A breakout above these levels would improve the technical outlook, while a loss of support near $0.068 could lead to additional downside.
For long-term investors, patience remains important. As with any cryptocurrency, Dogecoin's future will depend on broader market trends, adoption, investor sentiment, and macroeconomic conditions. While recovery is possible over the coming years, price forecasts should be viewed as scenarios rather than certainties.