
Bitcoin is trading near a key technical level as buyers attempt to extend the recent recovery. This in-depth analysis explores Bitcoin's short-term outlook, support and resistance zones, multi-timeframe technical indicators, and long-term price predictions through 2030 to help readers better understand the current market.

Bitcoin is trading near a key technical level as buyers attempt to extend the recent recovery. This in-depth analysis explores Bitcoin's short-term outlook, support and resistance zones, multi-timeframe technical indicators, and long-term price predictions through 2030 to help readers better understand the current market.
Last Updated: July 25, 2026
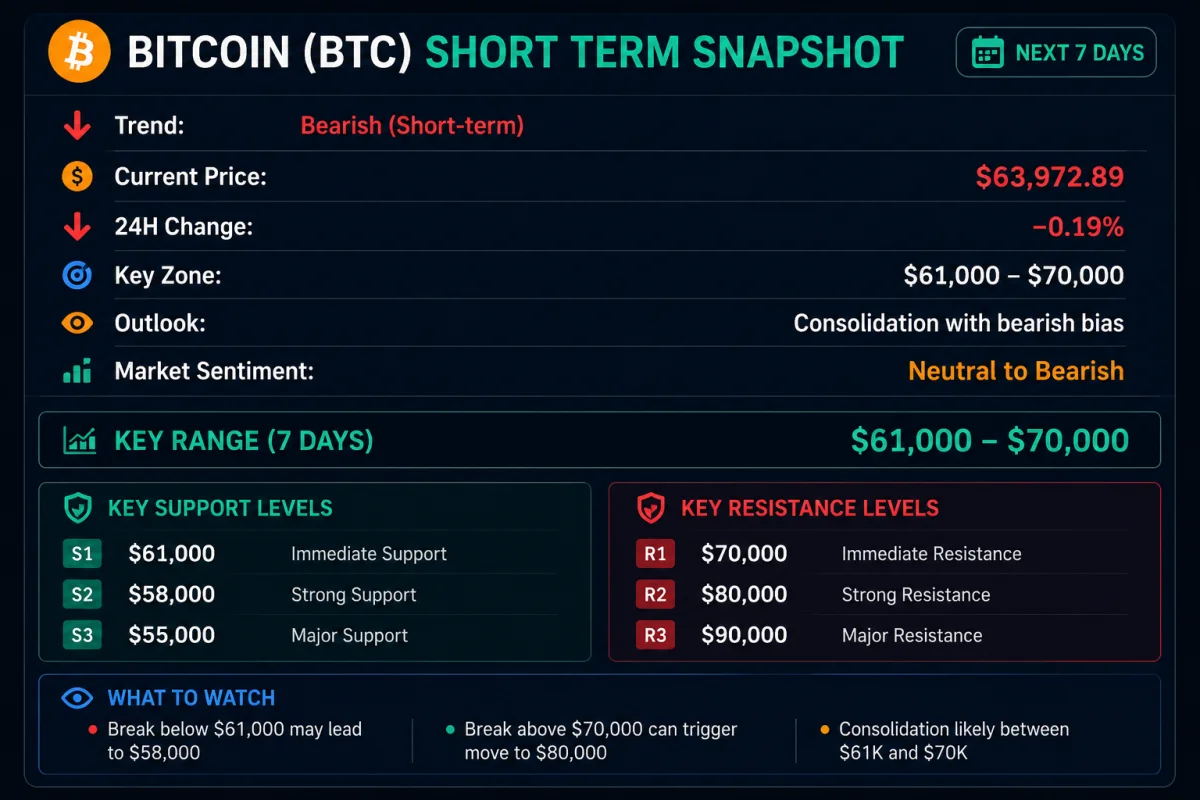
Bitcoin Price Quick Snapshot July ( Next 7 days )
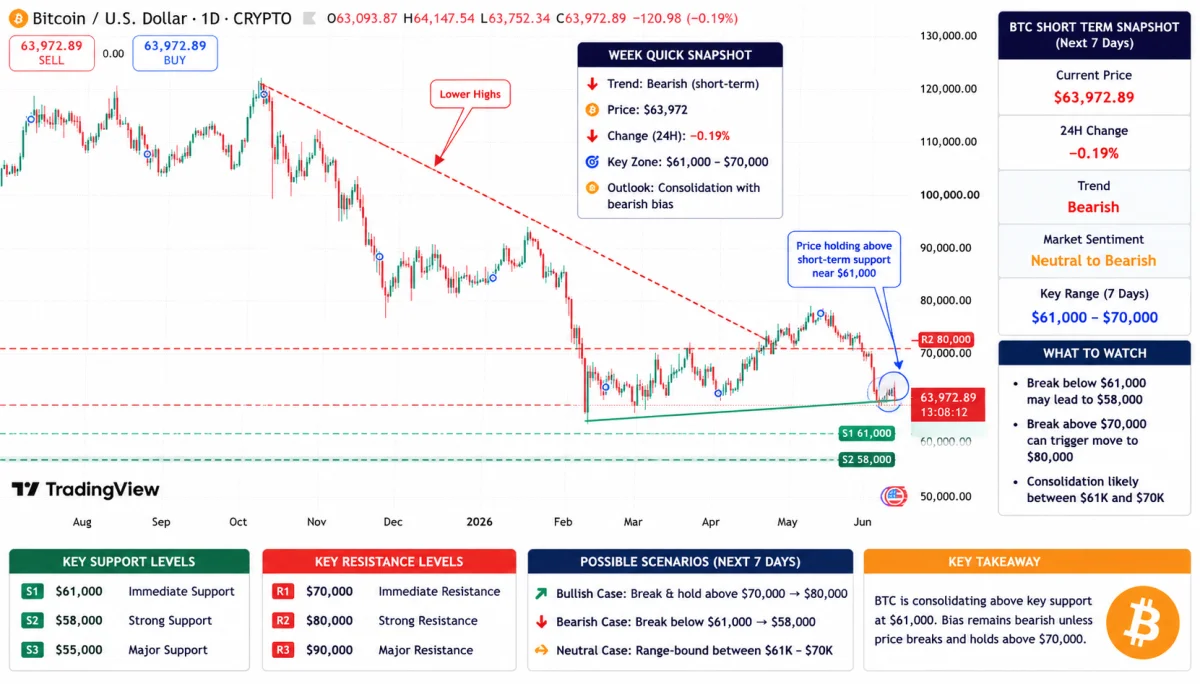
Current Trend
Bearish to Neutral (Short-Term)
Current Price
$63,972.89
24-Hour Change
-0.19%
Market Structure
- Lower highs continue to limit upside momentum.
- Price is stabilizing near a key support zone.
- Buyers need a breakout above resistance to confirm a stronger recovery.
Outlook (Next 7 Days)
Consolidation with a slight bearish bias
Bitcoin is trading within a critical range. As long as price holds above $61,000, the market could continue moving sideways before attempting another push higher. A confirmed breakout above $70,000 would strengthen the bullish outlook.
Key Support Levels
| Level | Importance |
|---|---|
| $61,000 | Immediate Support |
| $58,000 | Strong Support |
| $55,000 | Major Support |
Key Resistance Levels
| Level | Importance |
|---|---|
| $70,000 | Immediate Resistance |
| $80,000 | Strong Resistance |
| $90,000 | Major Resistance |
Bullish Scenario
- Hold above $61,000
- Break and close above $70,000
- Target: $75,000–$80,000
Bearish Scenario
- Lose $61,000 support
- Increased selling pressure
- Target: $58,000, with $55,000 as the next major support
Expected Trading Range (Next 7 Days)
$61,000 – $70,000
Bitcoin (BTC) remains the world's largest cryptocurrency and continues to attract traders, investors, institutions, and governments. After experiencing strong volatility in recent months, Bitcoin is now trading around $65,800, placing it at an important technical level. While the short-term trend is improving, the higher timeframes still show mixed signals, making the coming weeks especially important for determining Bitcoin's next major move.
In this Bitcoin price prediction, we analyze the latest 4-hour, daily, weekly, and monthly charts to understand where the market could be heading next. We also examine important support and resistance levels, moving averages, momentum indicators, and market structure to provide a balanced outlook for both short-term traders and long-term investors.
Whether you are planning your next trade or simply want to understand Bitcoin's market direction, this guide explains the current situation in simple language without unrealistic promises or speculation.
Bitcoin Price Today
| Metric | Value |
|---|---|
| Asset | Bitcoin (BTC) |
| Current Price | Around $65,800 |
| Short-Term Trend | Bullish |
| Daily Trend | Sideways |
| Monthly Trend | Long-Term Bullish Structure |
| Overall Market Bias | Neutral to Moderately Bullish |
Bitcoin has recovered from recent lows and is now trading above several important moving averages on lower timeframes. However, the daily and weekly charts still show resistance levels that buyers must overcome before a stronger uptrend can be confirmed.
Key Takeaways
If you only have a minute, here are the most important points from our analysis:
- Bitcoin is trading near $65,800, a major technical area.
- The 4-hour chart remains bullish with higher highs and higher lows.
- The daily chart is recovering but has not confirmed a full trend reversal.
- The weekly chart still shows a broader bearish structure.
- The monthly chart continues to support Bitcoin's long-term growth story.
- Immediate resistance is around $68,000–$70,000.
- Strong support sits between $64,000 and $65,000.
- If Bitcoin breaks above $68,000 with strong volume, buyers could target the low $70,000 region.
- A loss of $64,000 may increase the chances of another pullback toward the high $50,000s or low $60,000s.
Bitcoin Price Prediction Summary
| Timeframe | Prediction | Confidence |
|---|---|---|
| Next 24 Hours | Sideways to Slightly Bullish | Medium |
| Next 7 Days | Bullish Bias | Medium |
| Remaining July 2026 | $64,500–$69,000 | Medium |
| August 2026 | Moderately Bullish | Medium |
| End of 2026 | Higher than Current Levels if Resistance Breaks | Medium |
| Long Term (2027–2030) | Bullish | Medium to High |
These projections are based on technical analysis and current market conditions. Cryptocurrency markets are highly volatile, so prices can change quickly due to macroeconomic news, regulation, institutional demand, or unexpected events.
Bitcoin Price Prediction for the Rest of July 2026
Bitcoin has entered the second half of July with improving short-term momentum. Buyers have defended important support levels, and the market is attempting to build a series of higher highs and higher lows on the 4-hour chart. However, resistance on the daily chart continues to limit stronger upside moves.
Bullish Scenario
If Bitcoin remains above $64,800 and breaks through the $68,000 resistance zone with increased trading volume, the market could continue moving higher.
Potential upside targets include:
- Target 1: $68,500
- Target 2: $70,000
- Target 3: $72,000–$73,000
A successful breakout would likely improve market sentiment and encourage more buyers to enter the market.
Neutral Scenario
The most likely short-term outcome is continued consolidation between support and resistance. In this case, Bitcoin may trade within a relatively narrow range while investors wait for a stronger catalyst.
Expected range:
$64,500–$68,000
This type of sideways movement is common after a recovery and often helps the market build momentum for its next major move.
Bearish Scenario
If Bitcoin falls below $64,000 with strong selling pressure, the market could revisit lower support zones.
Potential downside targets:
- $62,500
- $61,000
- $59,800
A break below these levels would weaken the current recovery and shift short-term momentum back in favor of sellers.
Bitcoin Daily Price Prediction (Remaining July 2026)
The following table provides a technical outlook based on current price action. These are projected trading ranges rather than guaranteed closing prices.
| Date | Expected Range | Outlook |
|---|---|---|
| July 23 | $65,000–$66,500 | Neutral |
| July 24 | $65,200–$66,800 | Slightly Bullish |
| July 25 | $65,000–$67,000 | Bullish |
| July 26 | $65,300–$67,200 | Bullish |
| July 27 | $65,500–$67,500 | Bullish |
| July 28 | $65,700–$67,800 | Bullish |
| July 29 | $66,000–$68,000 | Bullish |
| July 30 | $66,000–$68,500 | Bullish |
| July 31 | $66,500–$69,000 | Bullish |
These projections assume no major macroeconomic events, unexpected regulatory announcements, or significant shifts in institutional demand.
Current Market Overview
Bitcoin is currently showing a split personality across different timeframes.
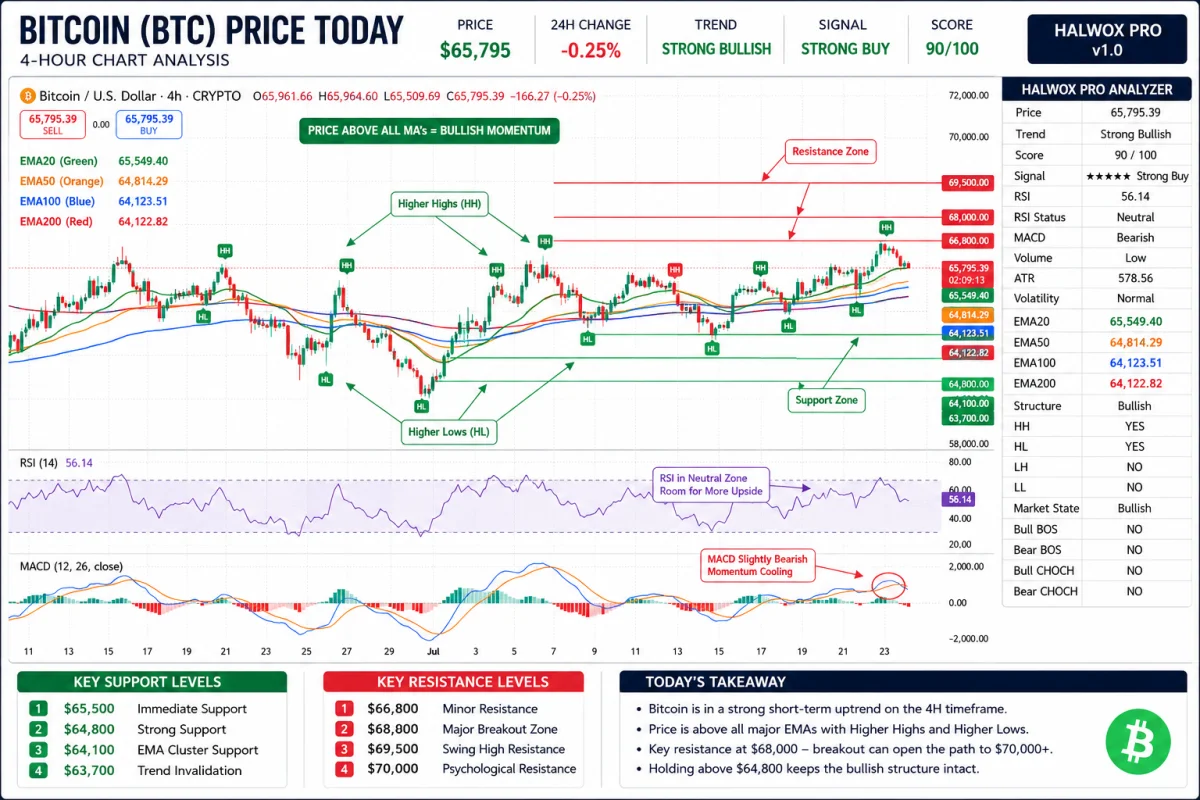
On the 4-hour chart, momentum favors buyers. Price is trading above the 20, 50, 100, and 200 exponential moving averages (EMAs), which is often a sign of a healthy short-term trend. Market structure also shows higher highs and higher lows, indicating that buyers are gradually gaining control.
The daily chart, however, tells a more cautious story. Although Bitcoin has recovered from recent lows, it has not yet broken above all major resistance levels. This means the broader recovery is still developing rather than fully confirmed.
Looking at the weekly chart, the market remains in a longer-term corrective phase. Sellers continue to defend key resistance zones, preventing Bitcoin from returning to the strong upward trend seen earlier in the cycle.
Despite this, the monthly chart continues to paint a more optimistic picture. Bitcoin remains above its long-term moving averages, and the broader market structure still supports the possibility of continued growth over the coming years if key support levels hold.
Bitcoin Technical Analysis: Multi-Timeframe Outlook
Technical analysis helps traders understand market direction by studying price movement, trends, and trading indicators. Instead of trying to predict the future with certainty, it measures the probability of different market scenarios based on current data.
For this analysis, we reviewed Bitcoin's 4-hour, daily, weekly, and monthly charts using the Halwox Pro Analyzer. Each timeframe tells a different part of the story. Shorter timeframes help identify near-term trading opportunities, while longer timeframes reveal the broader market trend.
Bitcoin 4-Hour Chart Analysis
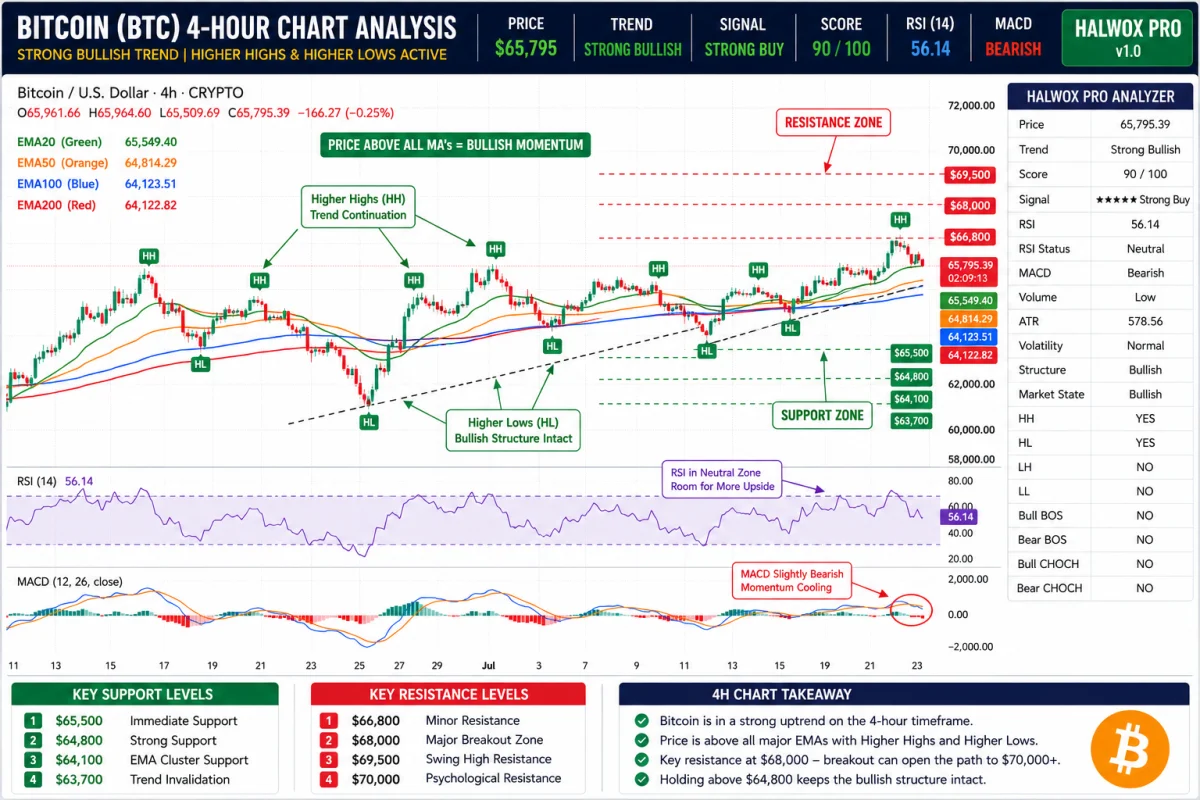
The 4-hour timeframe currently provides the strongest bullish signal among all the charts. Price continues to trade above all four major exponential moving averages (EMA20, EMA50, EMA100, and EMA200), which usually indicates that buyers remain in control of the short-term trend.
Our indicator assigns a Trend Score of 90/100 and generates a Strong Buy signal. This suggests that momentum is still favoring the bulls despite minor pullbacks.
What the 4-Hour Chart Shows
Trend
The trend remains strongly bullish. Price continues to form a series of Higher Highs (HH) and Higher Lows (HL), which is one of the clearest signs of an uptrend.
Every recent pullback has found support before making another push higher. This behavior shows that buyers are still willing to accumulate Bitcoin on dips.
Market Structure
Current market structure remains healthy because:
- Higher Highs are active.
- Higher Lows are active.
- No Lower Low has formed.
- No bearish Change of Character (CHOCH) has appeared.
This means the short-term trend has not yet been broken.
Moving Averages
The moving averages are stacked in a bullish order.
| Indicator | Status |
|---|---|
| EMA20 | Price Above |
| EMA50 | Price Above |
| EMA100 | Price Above |
| EMA200 | Price Above |
When price remains above all major moving averages, traders often consider it a sign that momentum favors buyers.
The EMA20 is also acting as dynamic support, meaning recent pullbacks have found buyers near this level.
RSI Analysis
The Relative Strength Index (RSI) is around 56, placing it in the neutral zone.
This is actually healthy for the current trend.
An RSI above 70 often suggests the market may be overheated, while an RSI below 30 can indicate oversold conditions. Sitting near the middle means Bitcoin still has room to move higher without immediately entering overbought territory.
MACD
Although the dashboard labels the MACD as Bearish, price action remains stronger than momentum weakness.
This tells us that:
- Momentum has slowed slightly.
- Buyers still control market structure.
- Traders should watch for a fresh bullish crossover before expecting another strong breakout.
Volume
Trading volume remains relatively low.
Low volume means buyers have not yet shown aggressive conviction.
A breakout above resistance accompanied by rising volume would significantly strengthen the bullish case.
Key Support Levels (4H)
| Level | Importance |
|---|---|
| $65,500 | Immediate Support |
| $64,800 | Strong Support |
| $64,100 | EMA Cluster |
| $63,700 | Trend Invalidation |
Holding above these support levels would keep the short-term uptrend intact.
Key Resistance Levels (4H)
| Level | Importance |
|---|---|
| $66,800 | Minor Resistance |
| $68,000 | Major Breakout Zone |
| $69,500 | Swing High |
| $70,000 | Psychological Resistance |
A decisive close above $68,000 would improve the probability of a move toward the $70,000 area.
Bitcoin Daily Chart Analysis
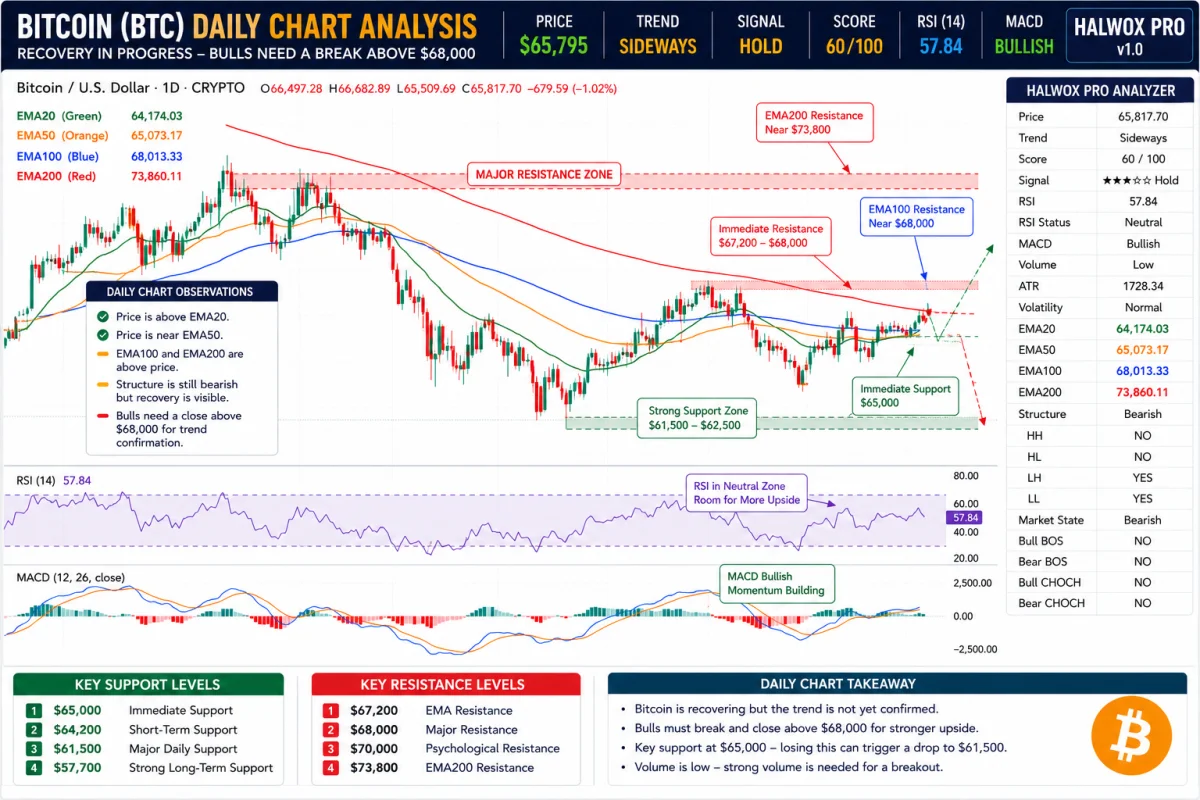
While the 4-hour chart is bullish, the daily timeframe paints a more cautious picture.
The daily chart currently shows a Sideways Trend with a Hold signal. This suggests that Bitcoin is recovering, but the larger trend has not yet shifted decisively in favor of buyers.
Daily Trend
The daily Trend Score stands at 60/100, indicating a balanced market rather than a strong trend.
Price is attempting to recover after a prolonged correction but still faces resistance from longer-term moving averages.
Market Structure
Unlike the 4-hour chart, the daily timeframe still reflects a broader bearish structure.
Current observations include:
- Lower Highs remain part of the recent trend.
- Lower Lows were established during the previous decline.
- Recovery is underway but not yet confirmed.
- Market structure needs a new Higher High to confirm a trend reversal.
In simple terms, buyers are improving conditions, but they have not completely taken control.
EMA Analysis
The daily EMA setup provides useful insight into the market's current stage.
| Moving Average | Interpretation |
|---|---|
| EMA20 | Price Above |
| EMA50 | Price Near |
| EMA100 | Price Below |
| EMA200 | Price Below |
This arrangement often appears during the early stages of a recovery.
The first goal for buyers is to reclaim the EMA100. A move above the EMA200 would provide much stronger evidence that the broader trend is turning bullish.
RSI
The daily RSI sits around 58, remaining within neutral territory.
This indicates:
- Momentum is improving.
- The market is not overheated.
- There is still room for additional upside.
MACD
The MACD has turned Bullish on the daily chart.
This is encouraging because MACD often changes direction before price fully confirms a new trend.
However, traders should wait for stronger price confirmation before assuming a sustained uptrend.
Daily Support Levels
| Level | Importance |
|---|---|
| $65,000 | Immediate Support |
| $64,200 | Swing Support |
| $61,500 | Major Daily Support |
| $57,700 | Strong Long-Term Support |
Daily Resistance Levels
| Level | Importance |
|---|---|
| $67,200 | EMA Resistance |
| $68,000 | Structural Resistance |
| $70,000 | Psychological Level |
| $73,800 | EMA200 Resistance |
Breaking above these levels would significantly strengthen Bitcoin's medium-term outlook.
What the Lower and Higher Timeframes Tell Us Together
One of the biggest mistakes new traders make is relying on a single timeframe.
Professional traders compare multiple timeframes before making decisions.
Right now, Bitcoin presents a mixed but improving picture:
- The 4-hour chart favors buyers and suggests short-term strength.
- The daily chart shows recovery but still requires confirmation.
- The weekly chart remains cautious, indicating that larger resistance levels have not yet been overcome.
- The monthly chart continues to support Bitcoin's long-term growth despite recent volatility.
This alignment suggests that Bitcoin may continue to perform well in the short term, but traders should remain aware of resistance levels on the higher timeframes.
Technical Summary
| Indicator | 4H | 1D | Interpretation |
|---|---|---|---|
| Trend | Strong Bullish | Sideways | Short-term strength |
| Structure | Bullish | Bearish Recovery | Improving |
| EMA Alignment | Bullish | Mixed | Positive |
| RSI | Neutral | Neutral | Healthy Momentum |
| MACD | Slightly Bearish | Bullish | Mixed |
| Volume | Low | Low | Breakout Needs Confirmation |
| Overall Bias | Bullish | Neutral | Moderately Bullish |
Bitcoin Weekly Technical Analysis
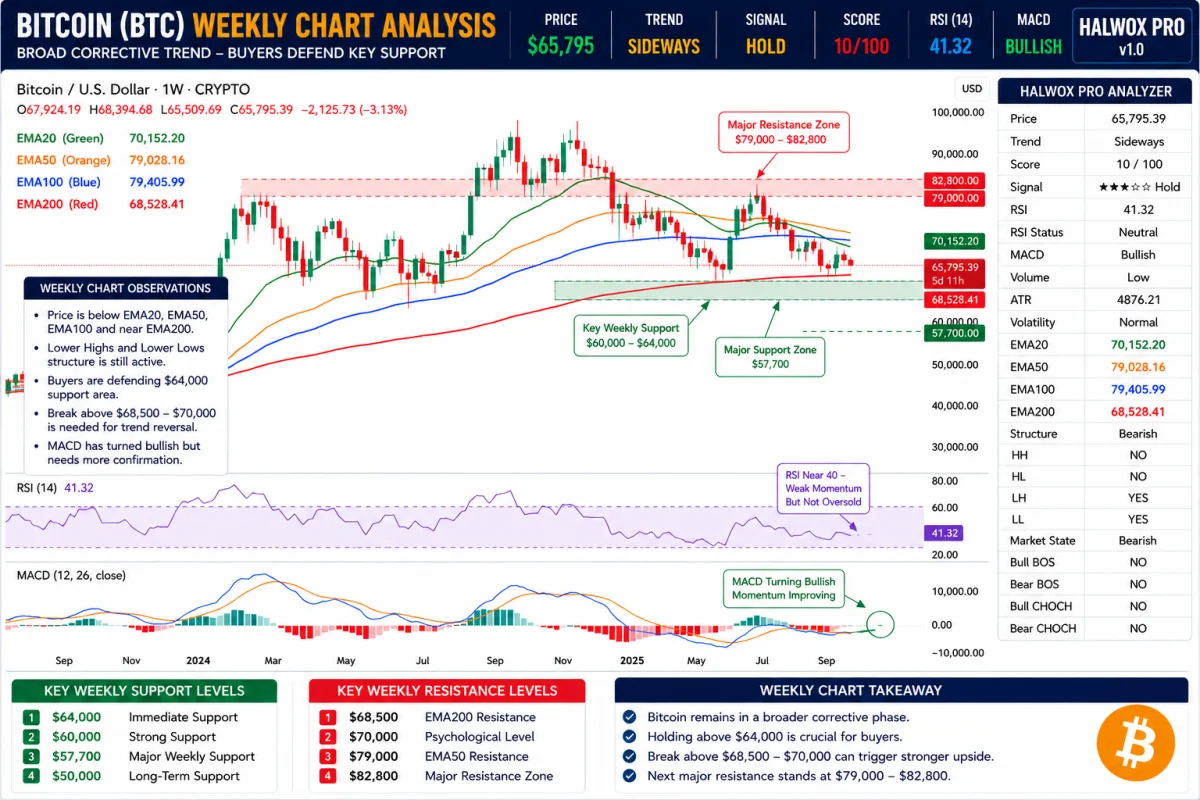
While the 4-hour chart shows short-term strength, the weekly chart provides the bigger picture. This timeframe is especially important for swing traders and long-term investors because it filters out short-term market noise.
According to your Halwox Pro Analyzer, Bitcoin is currently trading in a Sideways trend with a Trend Score of 10/100. The overall market structure remains bearish, even though the recent recovery has improved sentiment.
The weekly chart tells us that Bitcoin is trying to build a base after a large correction, but buyers have not yet reclaimed the major resistance levels that would confirm a long-term trend reversal.
Weekly Trend Analysis
Bitcoin is currently trading:
- Below EMA50
- Below EMA100
- Slightly below EMA200
- Below several important resistance zones
Although price has bounced from recent lows, the weekly trend still favors caution.
A true bullish reversal on the weekly chart usually requires:
- Higher High
- Higher Low
- Break above major resistance
- Strong trading volume
At the moment, not all of these conditions have been met.
Weekly Market Structure
The current weekly market structure shows:
| Structure | Status |
|---|---|
| Higher High | ❌ No |
| Higher Low | ❌ No |
| Lower High | ✅ Yes |
| Lower Low | ✅ Yes |
This means Bitcoin remains inside a broader corrective trend.
However, recent candles suggest selling pressure is gradually weakening.
If buyers continue defending support above $64,000, the probability of a larger recovery will improve over the coming weeks.
Weekly Moving Averages
| EMA | Value | Interpretation |
|---|---|---|
| EMA20 | ~$70,000 | Strong Resistance |
| EMA50 | ~$79,000 | Major Resistance |
| EMA100 | ~$79,400 | Long-Term Resistance |
| EMA200 | ~$68,500 | Key Decision Zone |
These moving averages create a resistance cluster between $68,500 and $79,500.
Breaking above this area would significantly improve Bitcoin's long-term technical outlook.
Weekly RSI
Weekly RSI sits near 41.
This is an important observation.
An RSI near 40 often appears after corrections rather than during strong bull markets.
It suggests:
- Selling momentum has slowed.
- Buyers are gradually returning.
- The market still has room to recover.
Weekly MACD
Interestingly, the MACD on the weekly chart has started turning bullish.
Momentum indicators often change direction before price fully reverses.
This does not guarantee a rally, but it is an encouraging sign that bearish momentum may be fading.
Weekly Support Levels
| Level | Importance |
|---|---|
| $64,000 | Immediate Support |
| $60,000 | Strong Support |
| $57,700 | Major Swing Support |
| $50,000 | Long-Term Support |
Weekly Resistance Levels
| Level | Importance |
|---|---|
| $68,500 | EMA200 |
| $70,000 | Psychological Resistance |
| $79,000 | EMA50 |
| $82,800 | Major Weekly Resistance |
Bitcoin Monthly Technical Analysis
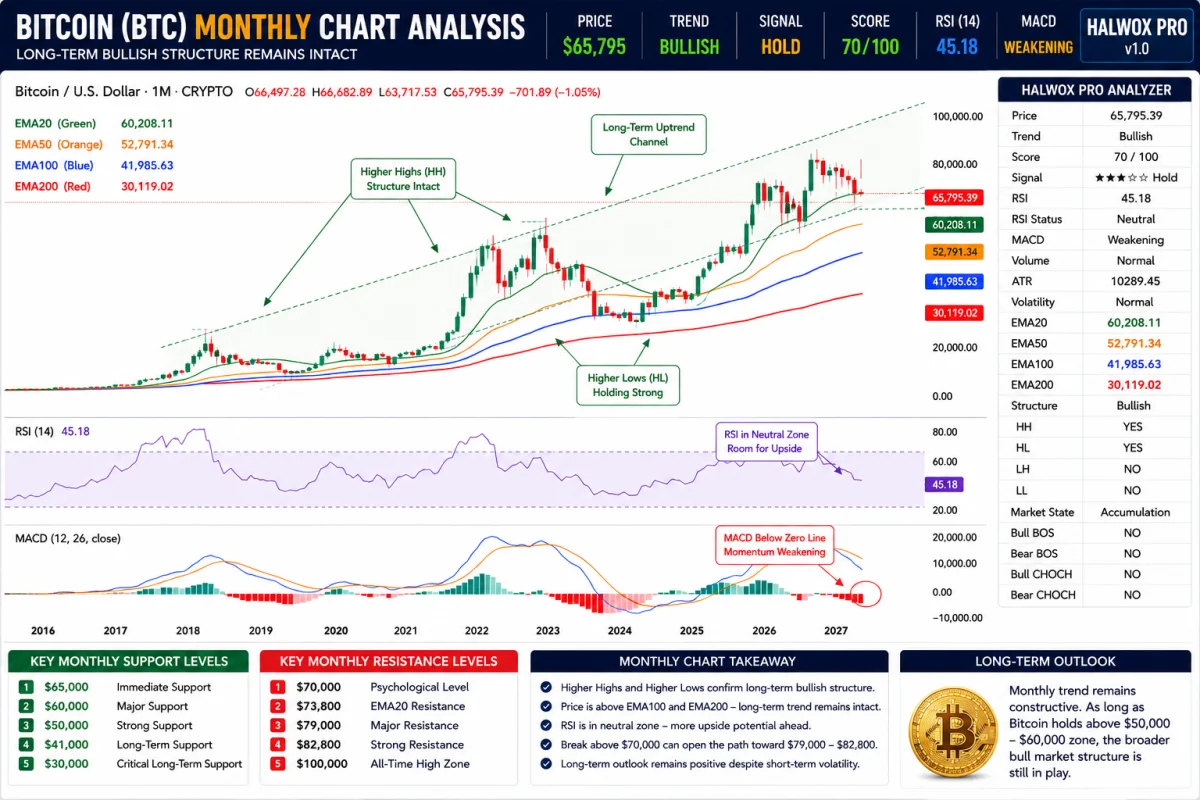
The monthly chart tells a very different story from the weekly chart.
Despite the recent correction, Bitcoin's long-term trend remains healthier than many investors realize.
Long-term moving averages continue to point upward, and Bitcoin still maintains a bullish market structure over the broader cycle.
Why the Monthly Chart Matters
Short-term charts often react to daily news and market sentiment.
Monthly charts focus on the larger investment cycle.
This helps investors understand whether Bitcoin is experiencing:
- A normal correction
- A bear market
- A long-term accumulation phase
- A new bull cycle
Currently, the monthly chart suggests Bitcoin remains in a long-term accumulation and recovery phase rather than a confirmed bear market.
Monthly Market Structure
According to your Halwox indicator:
| Structure | Status |
|---|---|
| Higher High | ✅ Yes |
| Higher Low | ✅ Yes |
| Lower High | ❌ No |
| Lower Low | ❌ No |
This is one of the strongest long-term signals available.
Higher Highs and Higher Lows are the foundation of a healthy bull market.
Although Bitcoin has corrected sharply from its highs, it has not yet broken the long-term bullish structure.
Monthly Moving Averages
Bitcoin remains comfortably above:
- EMA100
- EMA200
These two moving averages are often considered the dividing line between long-term bullish and bearish markets.
As long as Bitcoin stays above them, the broader trend remains constructive.
Monthly RSI
Monthly RSI is around 45, placing it near the middle of its historical range.
This indicates:
- Bitcoin is not extremely overbought.
- Bitcoin is not deeply oversold.
- Long-term momentum remains balanced.
Historically, major bull markets have often started when the monthly RSI begins rising from neutral levels.
Monthly MACD
Monthly MACD is currently weakening but has not yet confirmed a major bearish reversal.
This suggests that:
- Long-term momentum has slowed.
- The market may continue consolidating.
- A new bullish crossover could develop if buyers regain control.
Major Bitcoin Support and Resistance
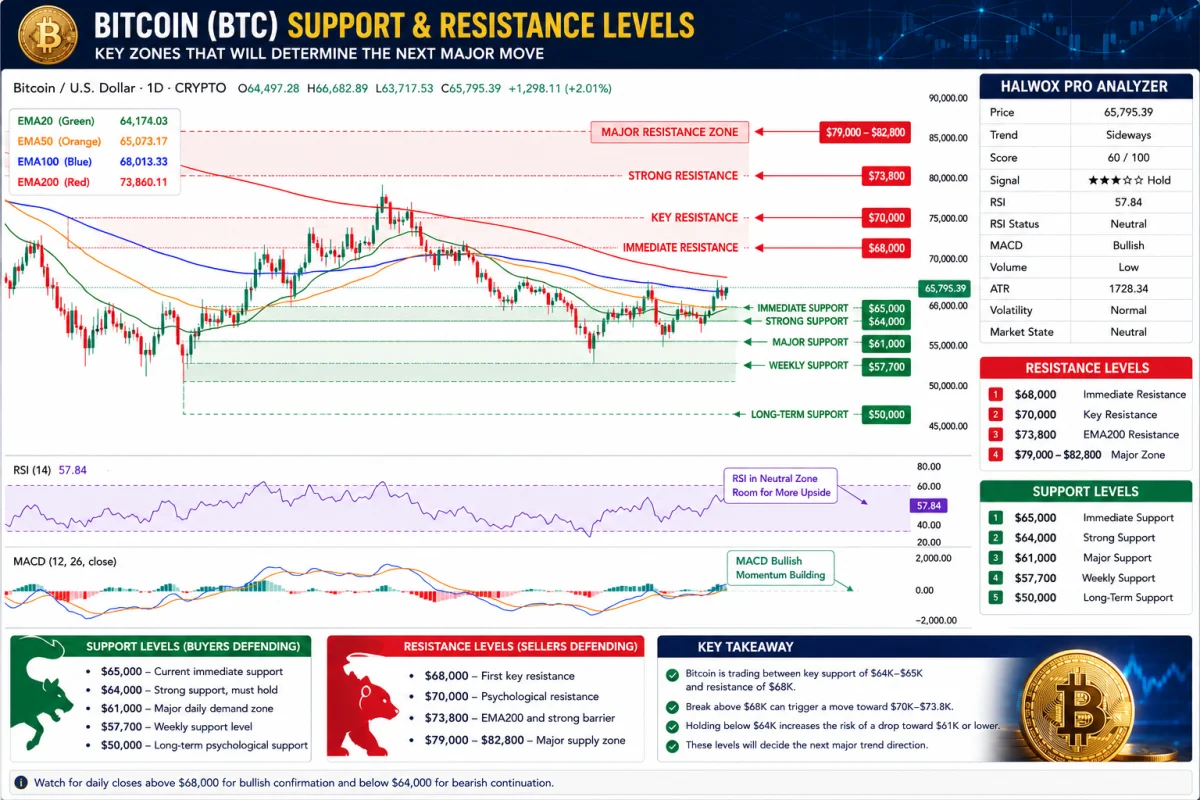
Strong Support Zones
| Price Level | Why It Matters |
|---|---|
| $65,000 | Current trading support |
| $64,000 | 4H structure support |
| $61,000 | Daily demand zone |
| $57,700 | Weekly support |
| $50,000 | Long-term psychological support |
Major Resistance Zones
| Price Level | Why It Matters |
|---|---|
| $68,000 | Daily resistance |
| $70,000 | Psychological level |
| $73,800 | Daily EMA200 |
| $79,000 | Weekly EMA50 |
| $82,800 | Major long-term resistance |
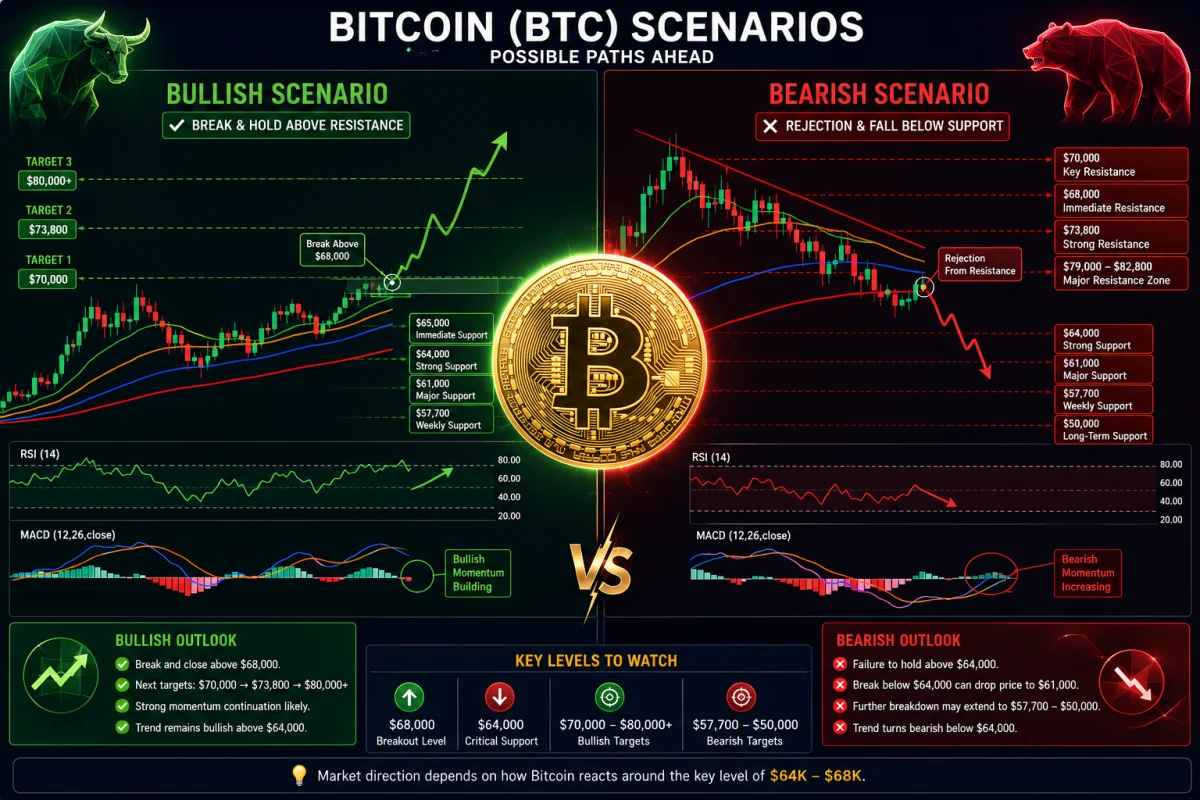
Bullish Scenario
Bitcoin's bullish outlook depends on buyers maintaining control above the current support zone.
A positive scenario would involve:
- Holding above $64,000.
- Breaking above $68,000 with strong trading volume.
- Closing above $70,000 on the daily chart.
- Reclaiming the weekly EMA200.
If these conditions are met, Bitcoin could gradually move toward the low-$70,000 range and later challenge higher resistance levels.
Bearish Scenario
The bearish case becomes stronger if Bitcoin fails to hold current support.
Warning signs include:
- Daily closes below $64,000.
- Increasing selling volume.
- A new Lower Low on the 4-hour chart.
- Loss of weekly support around $60,000.
If these signals appear together, Bitcoin could revisit the upper-$50,000 region before attempting another recovery.
Bitcoin Price Prediction: August–December 2026
| Month | Expected Low | Expected Average | Expected High | Outlook |
|---|---|---|---|---|
| August | $64,000 | $68,000 | $72,000 | Neutral to Bullish |
| September | $63,000 | $69,000 | $74,000 | Bullish |
| October | $65,000 | $72,000 | $78,000 | Bullish |
| November | $67,000 | $75,000 | $82,000 | Bullish |
| December | $70,000 | $80,000 | $88,000 | Moderately Bullish |
These ranges assume stable macroeconomic conditions and no major negative regulatory developments.
Bitcoin Long-Term Price Prediction (2027–2030)
Long-term forecasting is inherently uncertain. The following ranges are scenario-based estimates informed by historical Bitcoin market cycles, adoption trends, and the current long-term technical structure rather than guaranteed outcomes.
| Year | Conservative | Base Case | Bullish Scenario |
|---|---|---|---|
| 2027 | $75,000 | $95,000 | $120,000 |
| 2028 | $85,000 | $115,000 | $145,000 |
| 2029 | $95,000 | $130,000 | $165,000 |
| 2030 | $105,000 | $150,000 | $190,000 |
These projections should be viewed as possible ranges, not promises. Bitcoin's future price will depend on global adoption, regulation, institutional investment, macroeconomic conditions, and technological developments.
What Could Affect Bitcoin's Price?

Several factors could influence Bitcoin's direction over the coming months and years:
Institutional Adoption
Growing participation from investment funds, corporations, and financial institutions can increase demand for Bitcoin.
Spot Bitcoin ETFs
Continued inflows into spot Bitcoin exchange-traded funds may support long-term buying pressure.
Interest Rates
Lower interest rates generally encourage investment in higher-risk assets, while higher rates can reduce demand.
Government Regulation
Clear and supportive regulations may strengthen investor confidence, whereas restrictive policies could increase market volatility.
Global Economy
Inflation, geopolitical events, and broader financial market sentiment often affect cryptocurrency prices.
Bitcoin Network Activity
Increased transaction activity, adoption, and long-term holder accumulation can strengthen Bitcoin's overall market outlook.
Is Bitcoin a Good Investment?
Bitcoin remains one of the most established digital assets, with a long history of recovering from major market corrections. However, it is also highly volatile, and no investment is without risk.
Long-term investors should consider factors such as portfolio diversification, risk tolerance, investment horizon, and ongoing market developments before making decisions.
Rather than trying to buy or sell at the exact top or bottom, many investors prefer disciplined strategies such as dollar-cost averaging (DCA), which involves investing fixed amounts over time.
Frequently Asked Questions
What is Bitcoin's outlook for the rest of July 2026?
Based on the current technical setup, Bitcoin has a neutral-to-bullish outlook. Holding above key support near $64,000–$65,000 could allow another attempt to break resistance around $68,000–$70,000.
Is Bitcoin still in a bull market?
The answer depends on the timeframe. The short-term trend is bullish, the daily trend is improving, the weekly trend remains corrective, and the monthly chart still maintains a broader bullish structure.
What are the most important Bitcoin support levels?
Current support levels include $65,000, $64,000, $61,000, and $57,700.
What are the main resistance levels?
The key resistance zones are $68,000, $70,000, $73,800, and $79,000.
Can Bitcoin reach a new all-time high?
It is possible over the long term if adoption continues to grow and macroeconomic conditions remain supportive. However, there is no certainty, and investors should monitor market conditions rather than rely on fixed price targets.
Final Verdict
Bitcoin is at an important technical crossroads. The 4-hour chart shows encouraging bullish momentum, while the daily chart points to a recovery that still requires confirmation. On the weekly timeframe, sellers continue to defend major resistance levels, but the monthly chart suggests the broader long-term structure remains intact.
For the remainder of July 2026, the market is likely to focus on whether Bitcoin can maintain support above $64,000 and break through the $68,000–$70,000 resistance area. A successful breakout would strengthen the case for further gains, while a loss of key support could trigger another period of consolidation or a deeper pullback.
Overall, the technical picture favors cautious optimism. Short-term momentum has improved, but confirmation from higher timeframes is still needed before declaring the start of a sustained long-term uptrend.